This page displays active tropical cyclones and invests, updated automatically using the Tropycal python package. Data is available courtesy of
the National Hurricane Center (NHC) for Atlantic and East & Central Pacific cyclones, and the Joint Typhoon Warning Center (JTWC) globally. Click on any
storm below for more information. All images are free to share with credit.
This page is currently under construction, and more additions will be coming
soon. Contact tomerburg@gmail.com with any questions.
ACTIVE STORMS
3
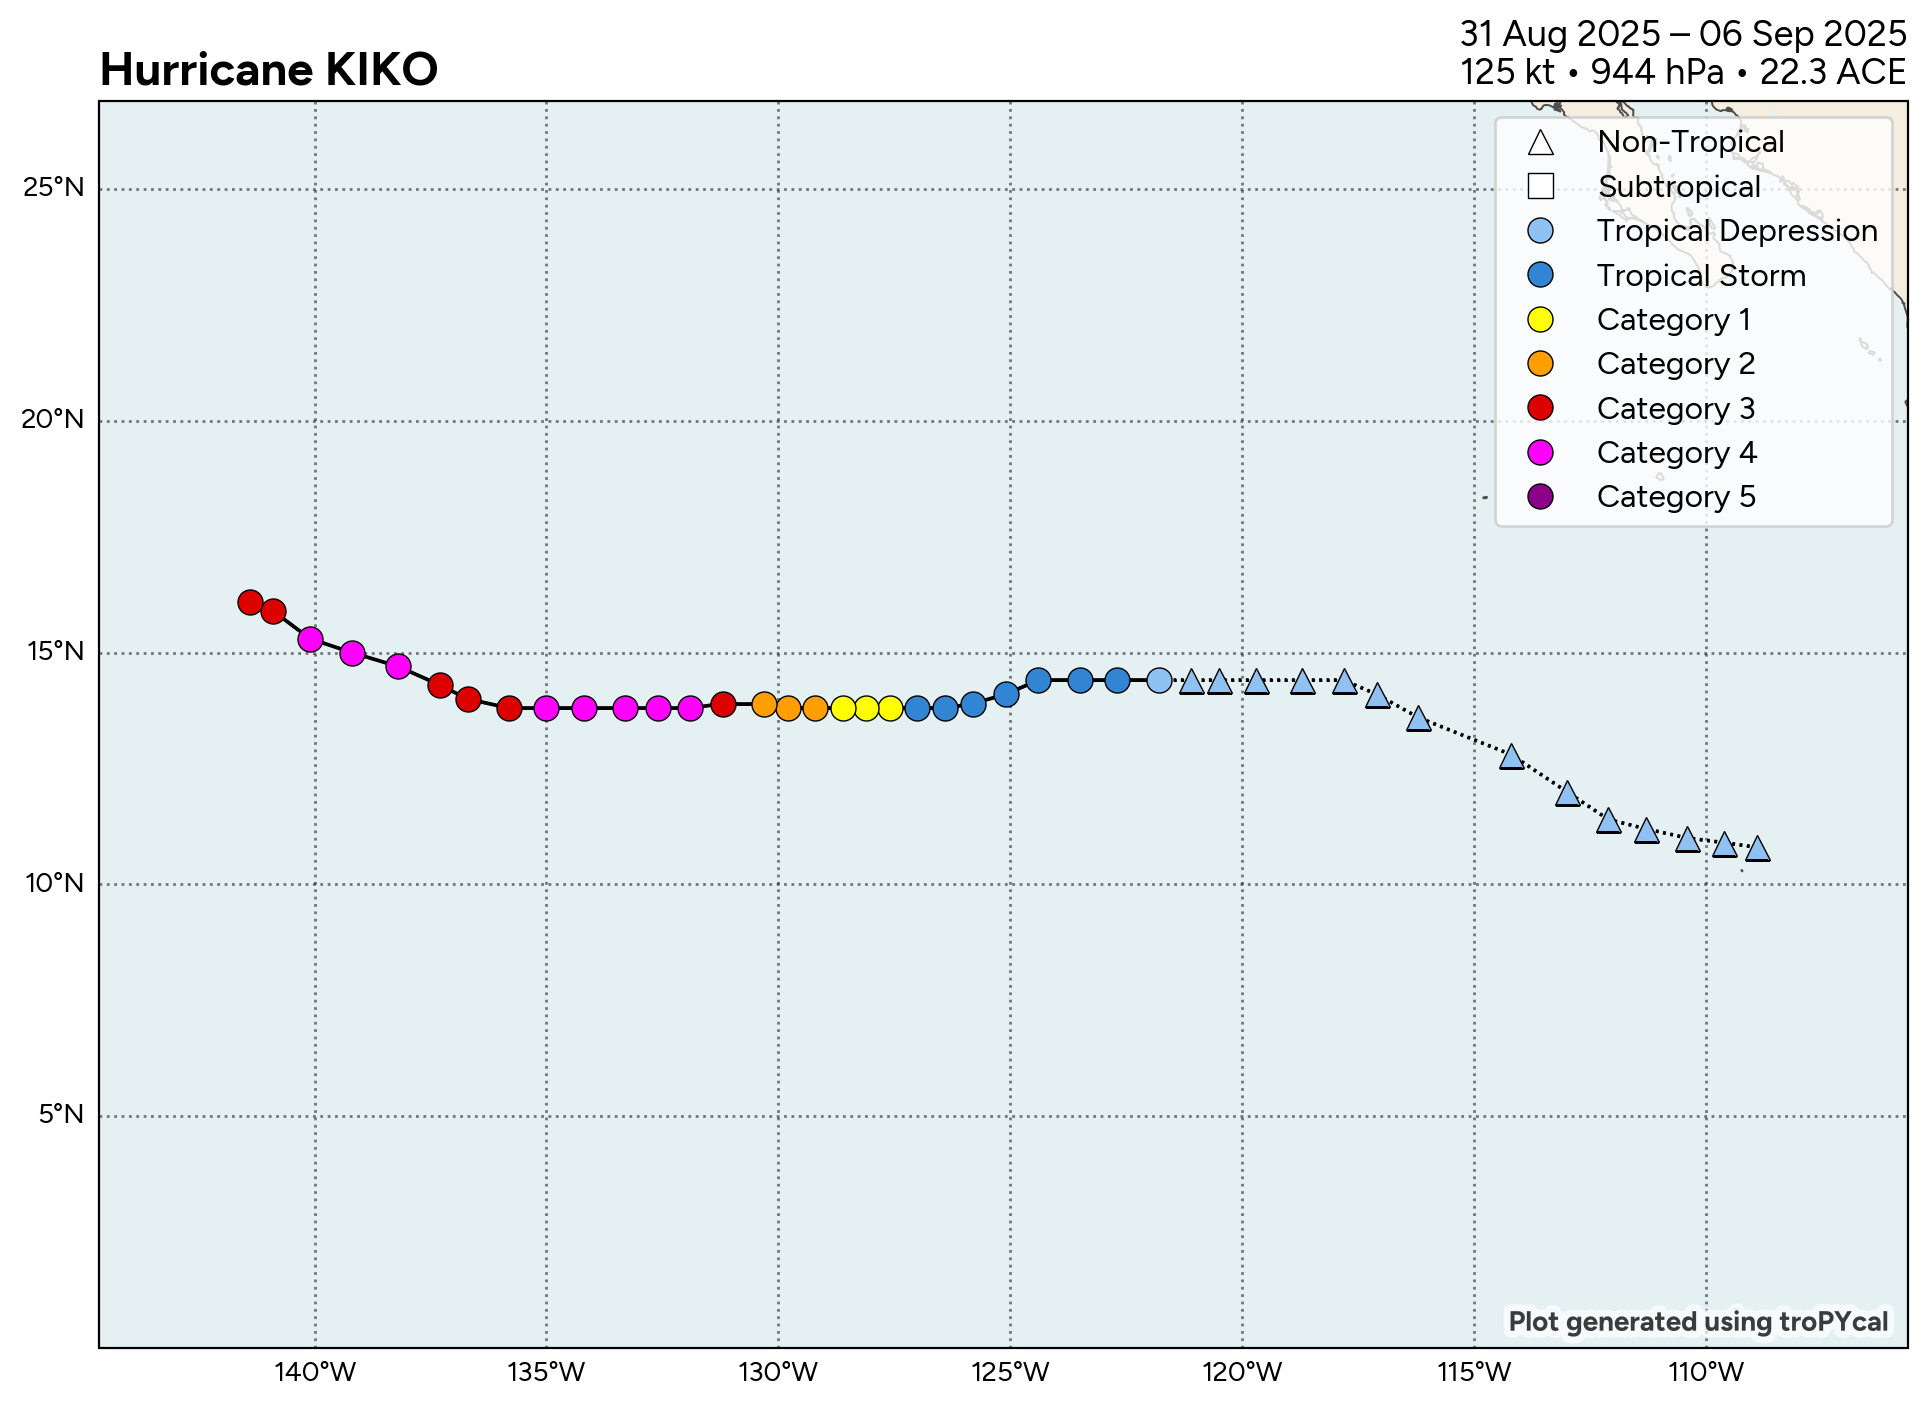
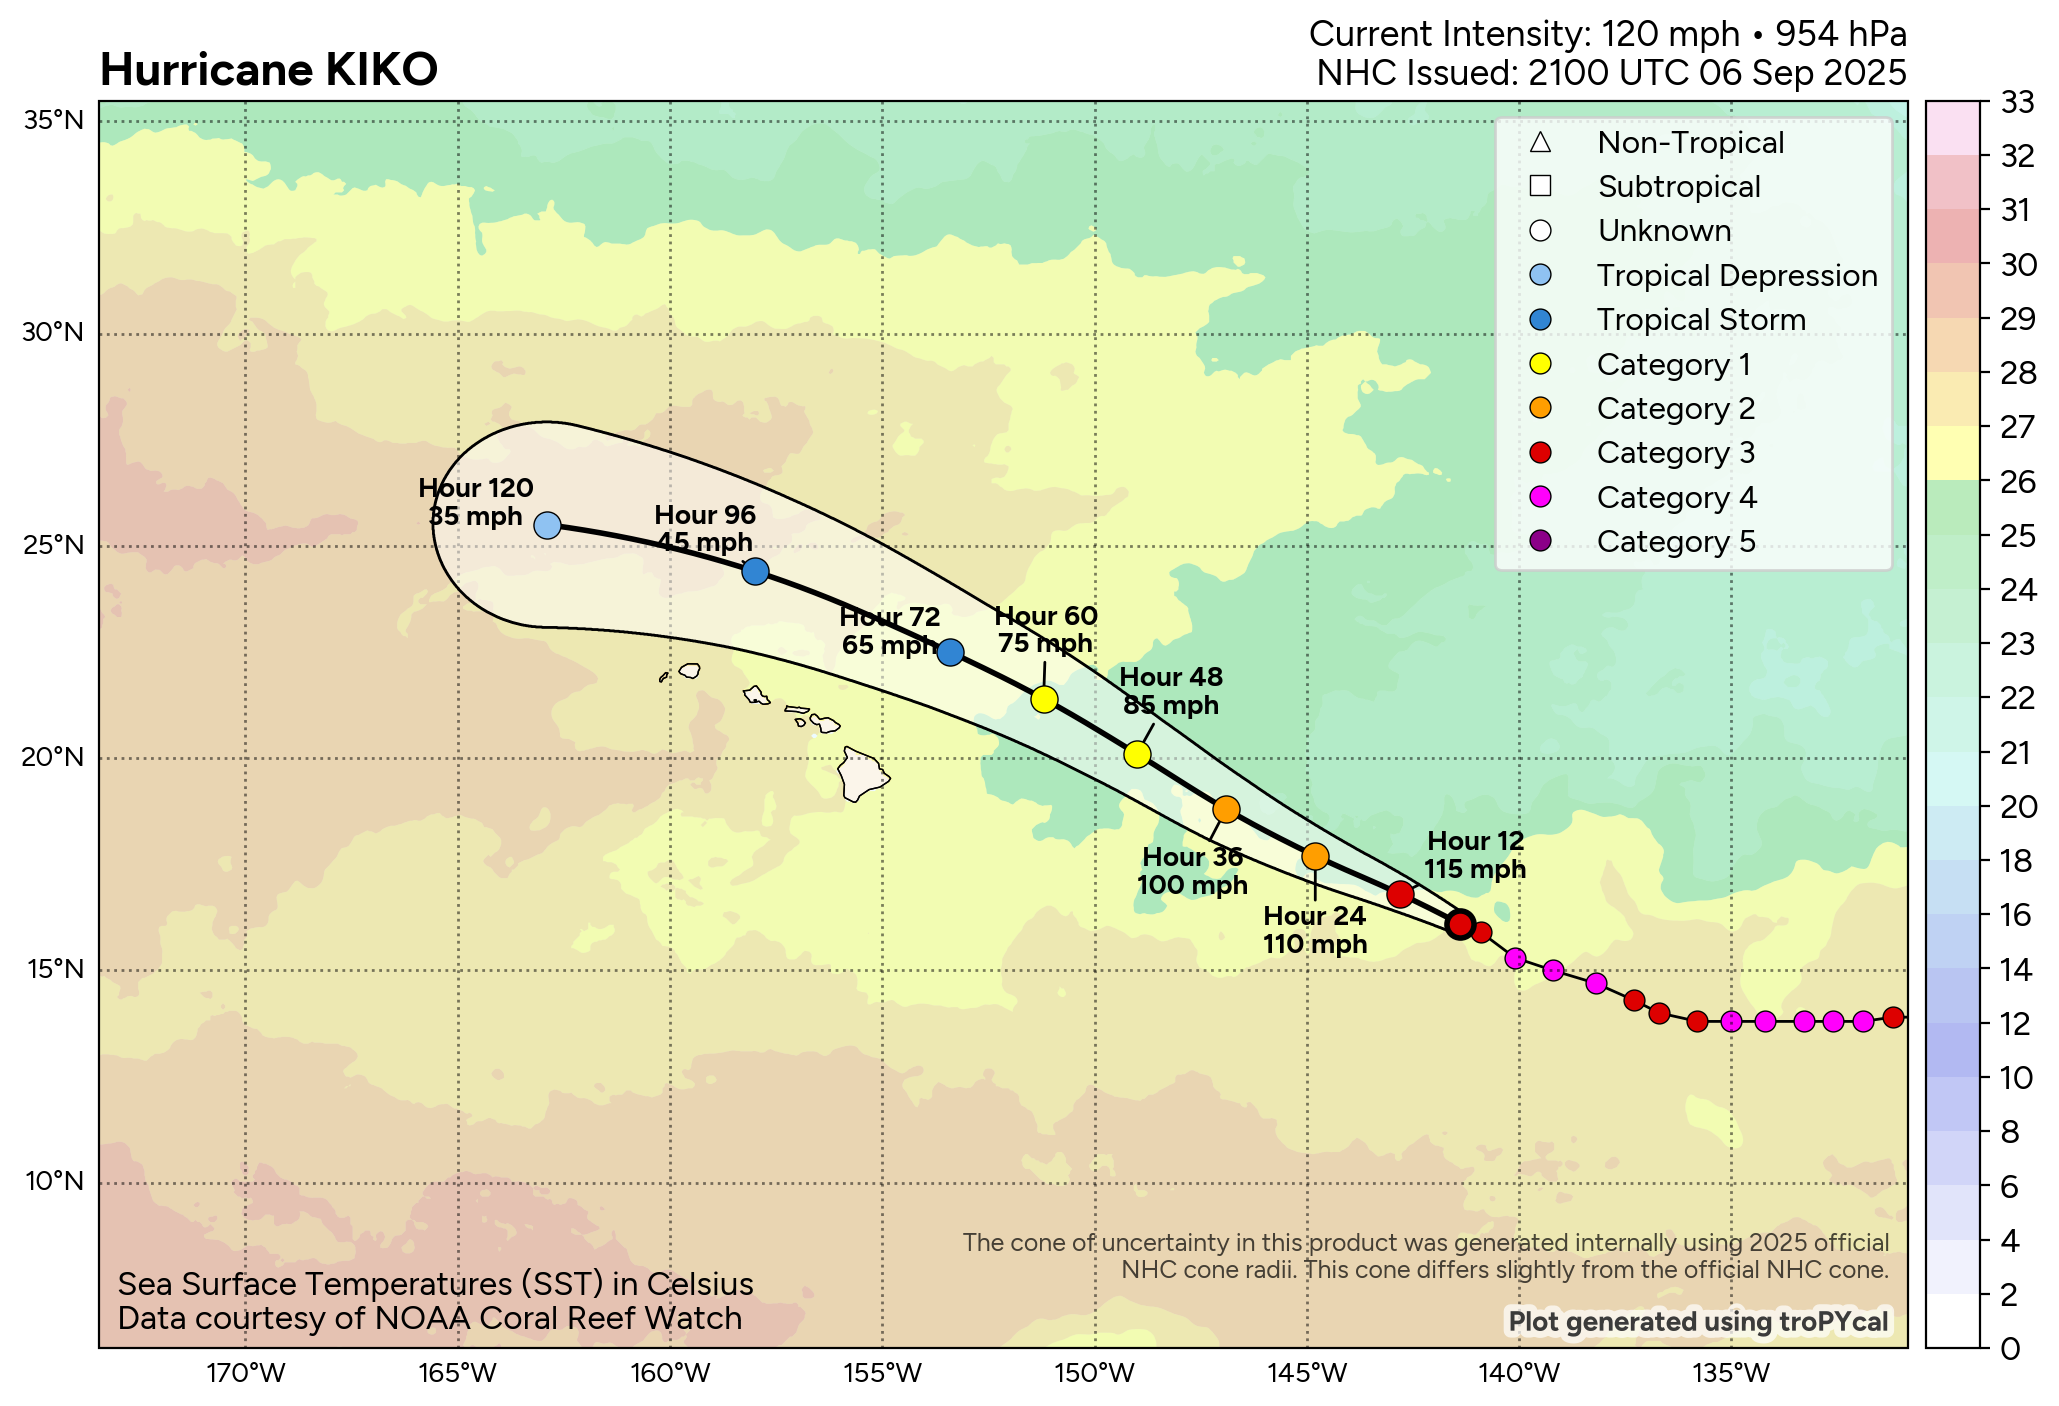
Hurricane Kiko
East Pacific • 125 mph • 951 hPa
S
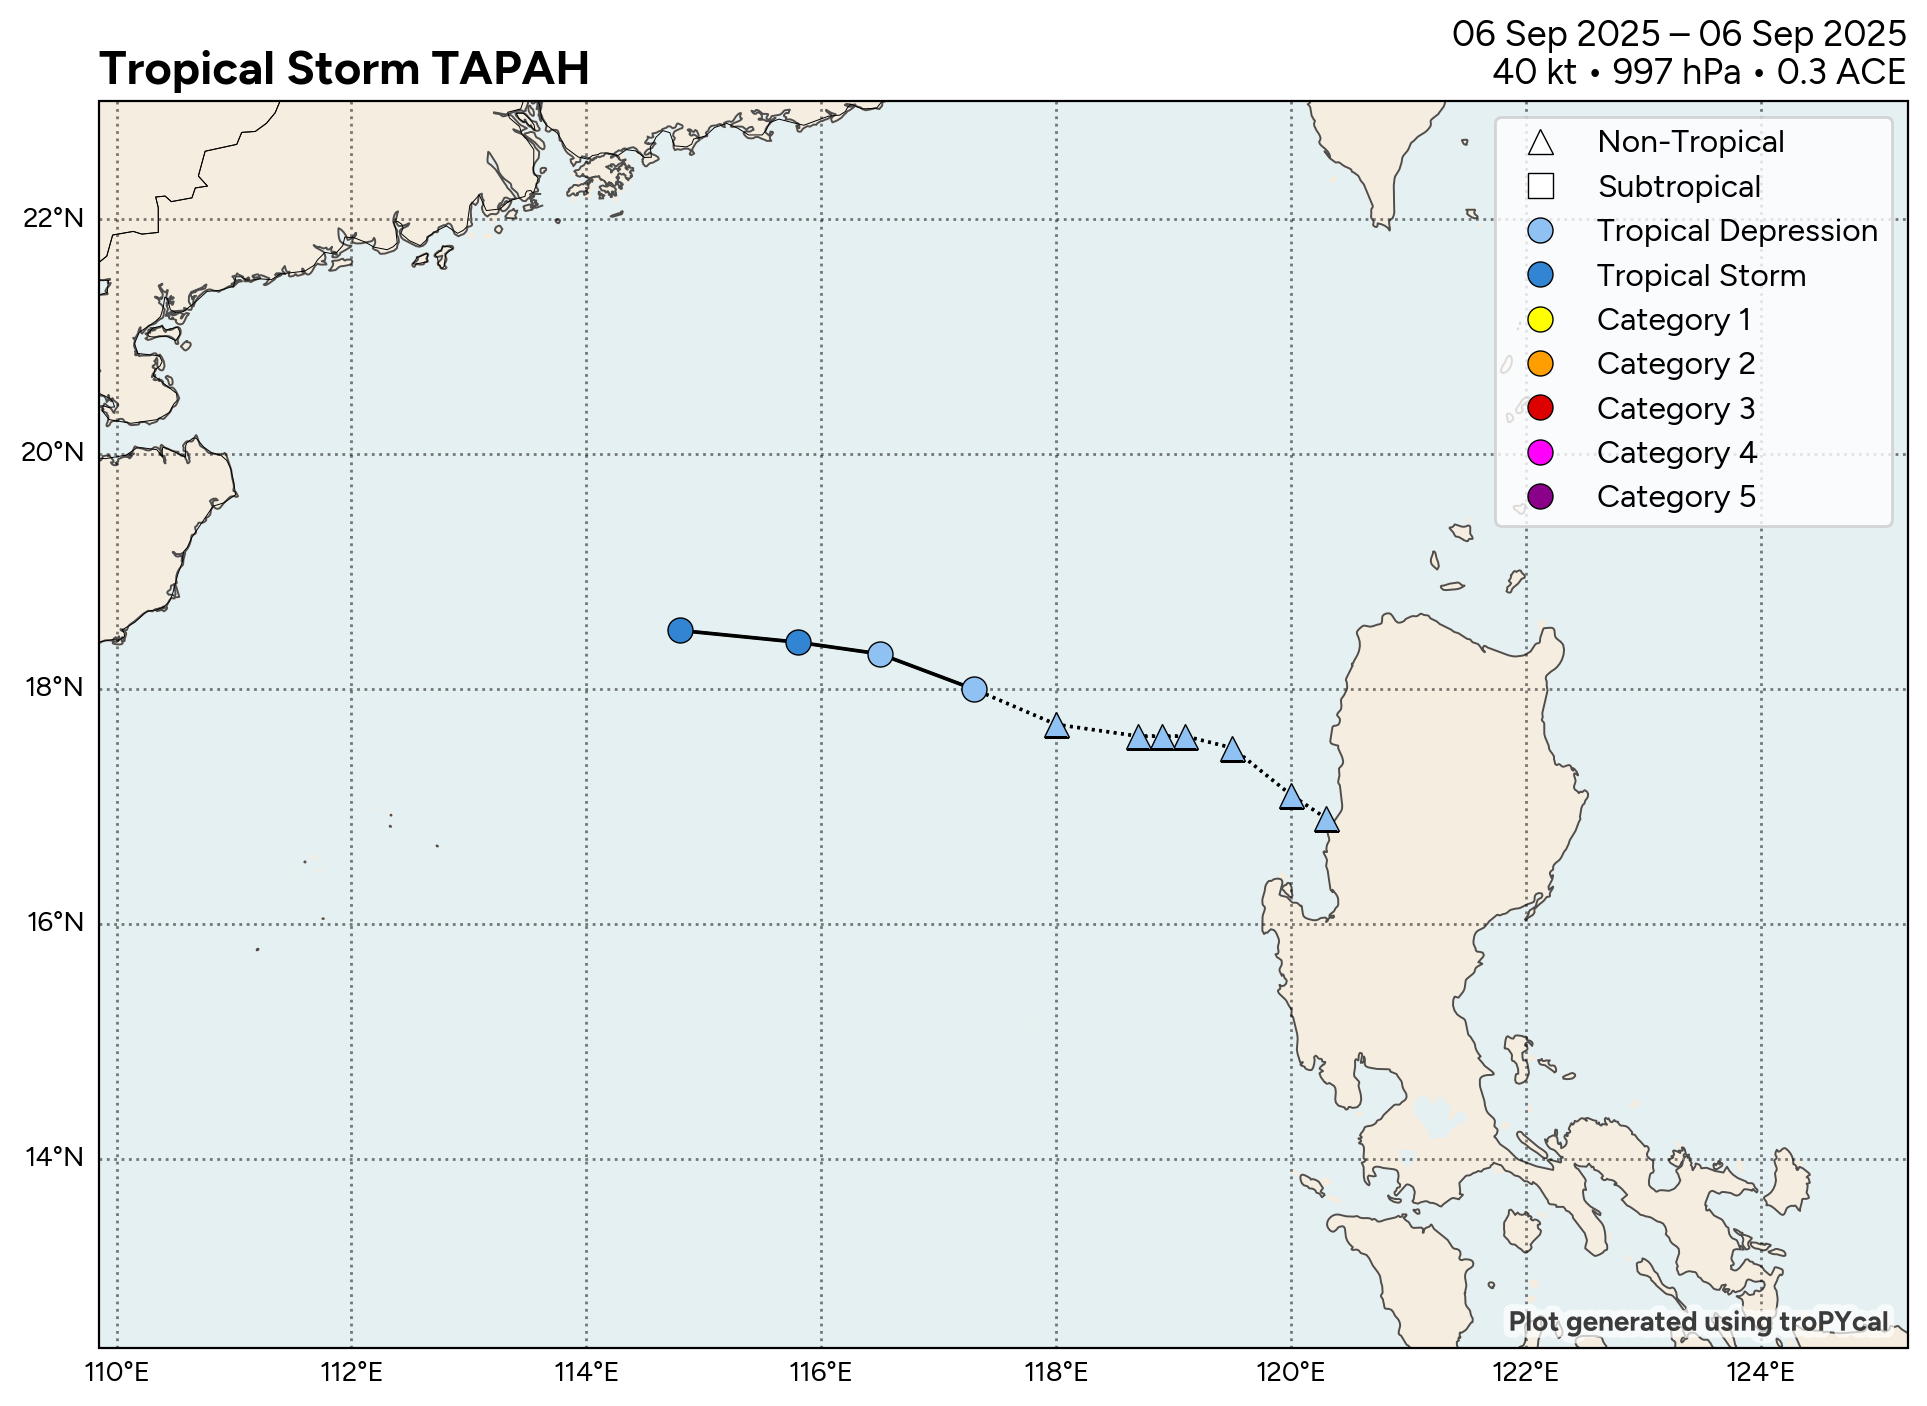
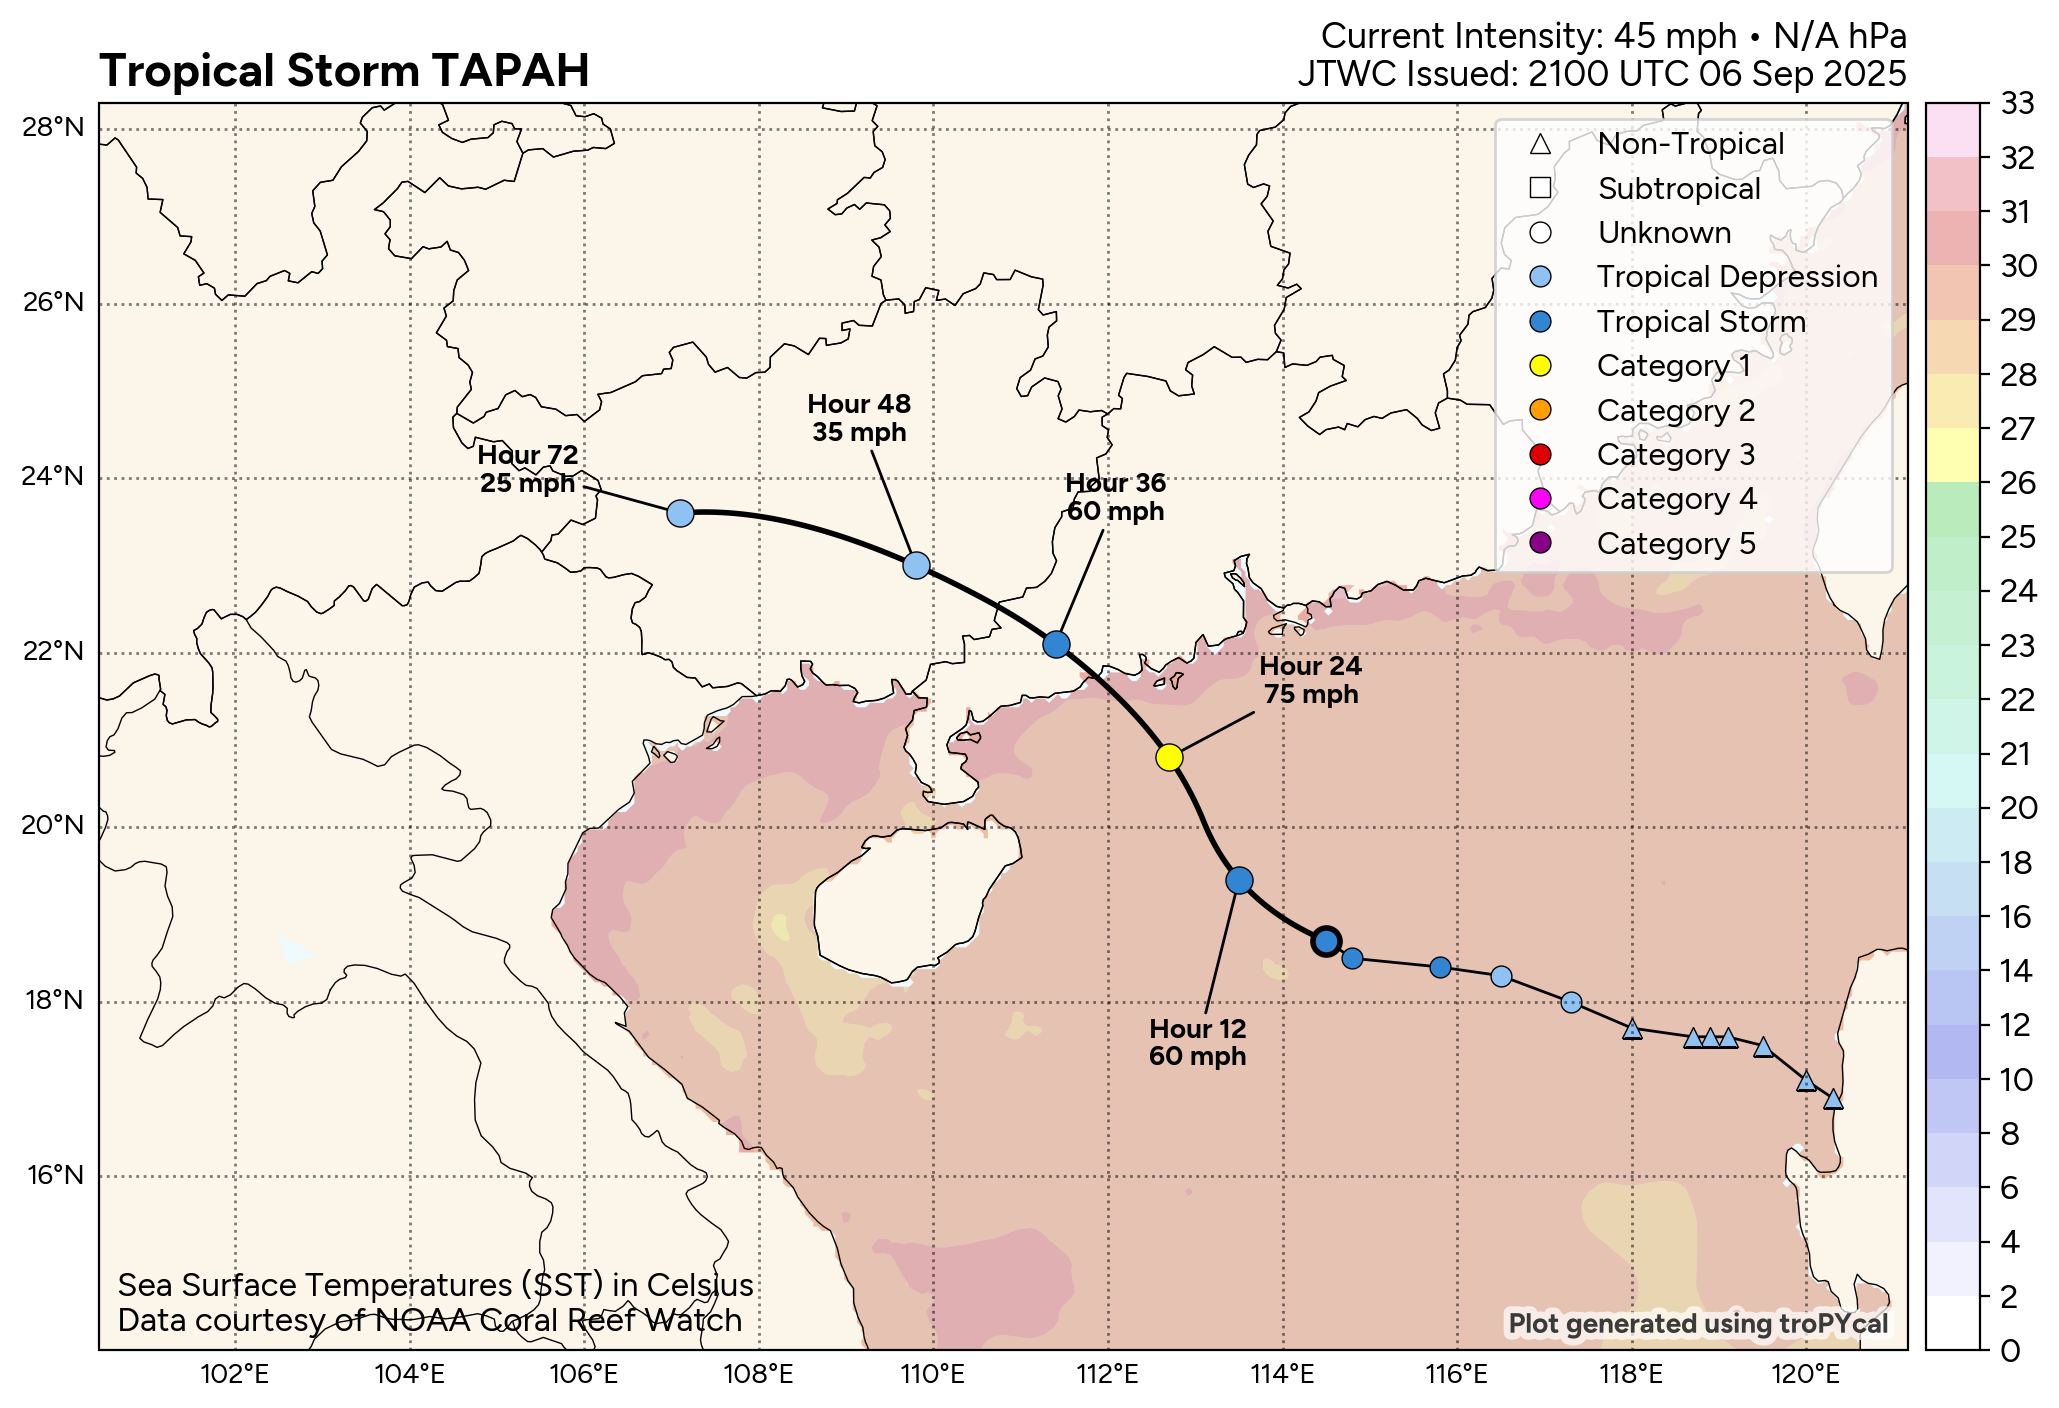
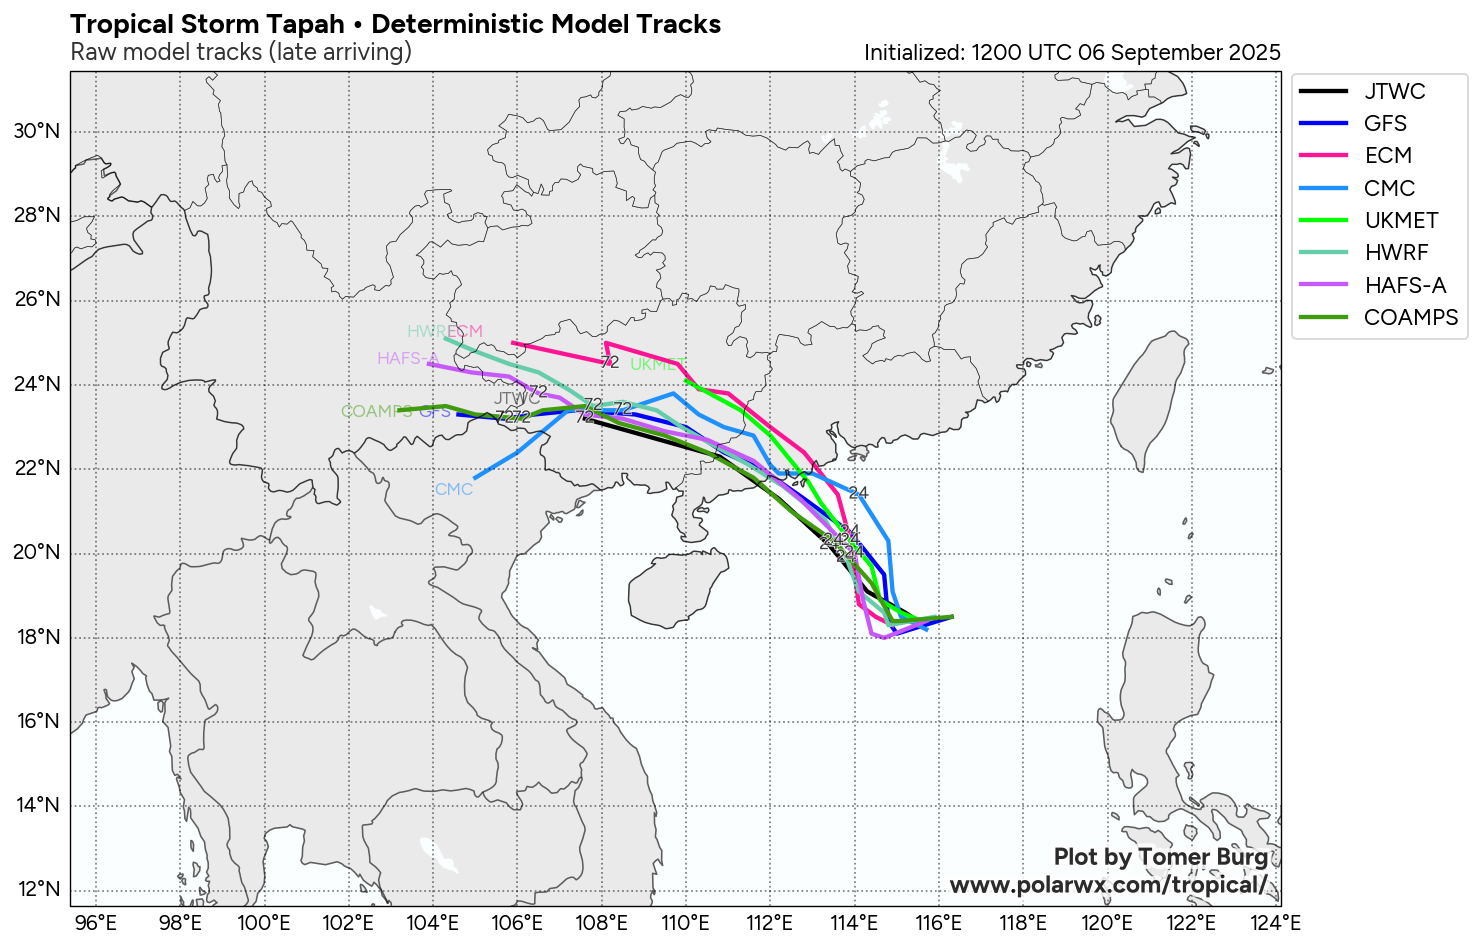
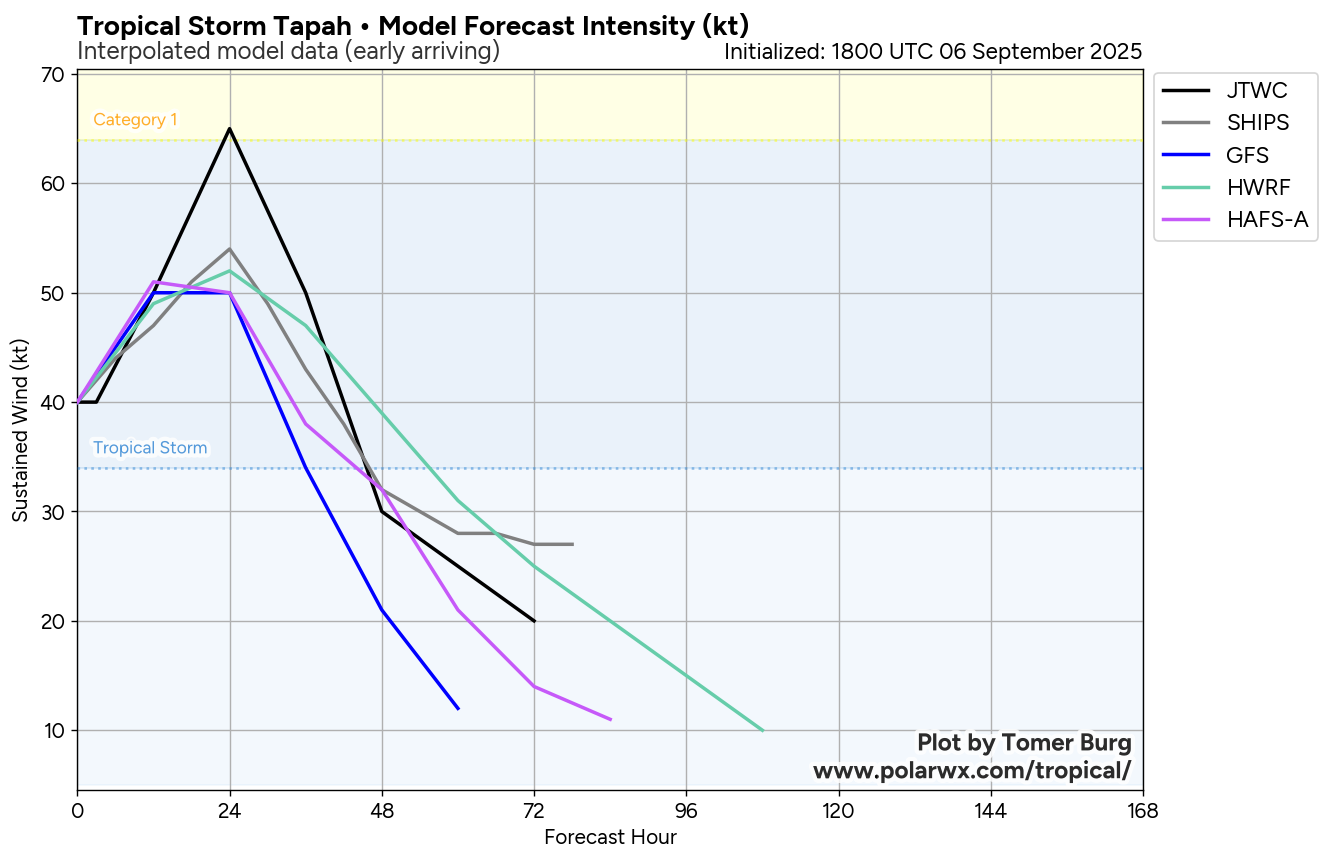
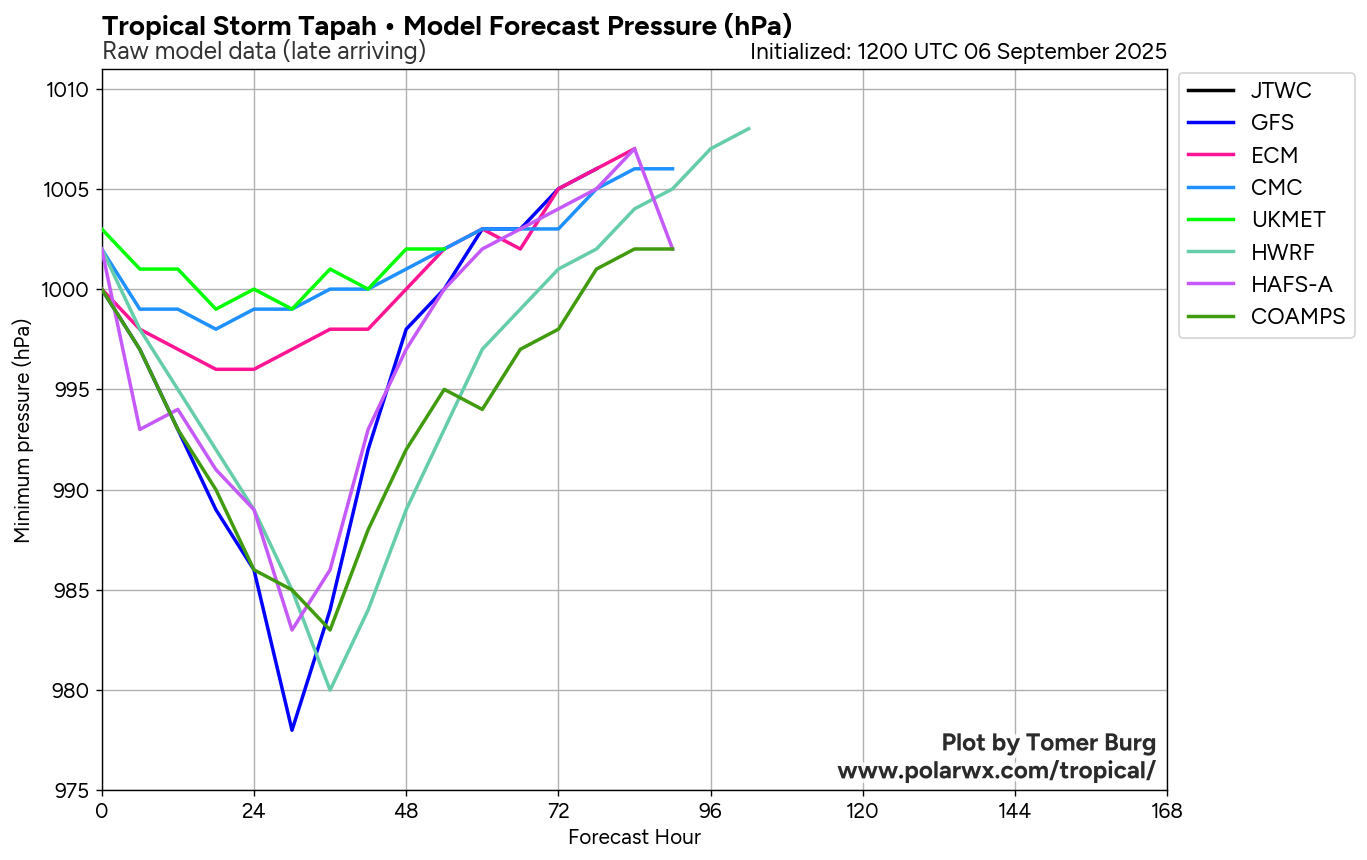
Tropical Storm Tapah
West Pacific • 45 mph • 997 hPa
ACTIVE INVESTS
X
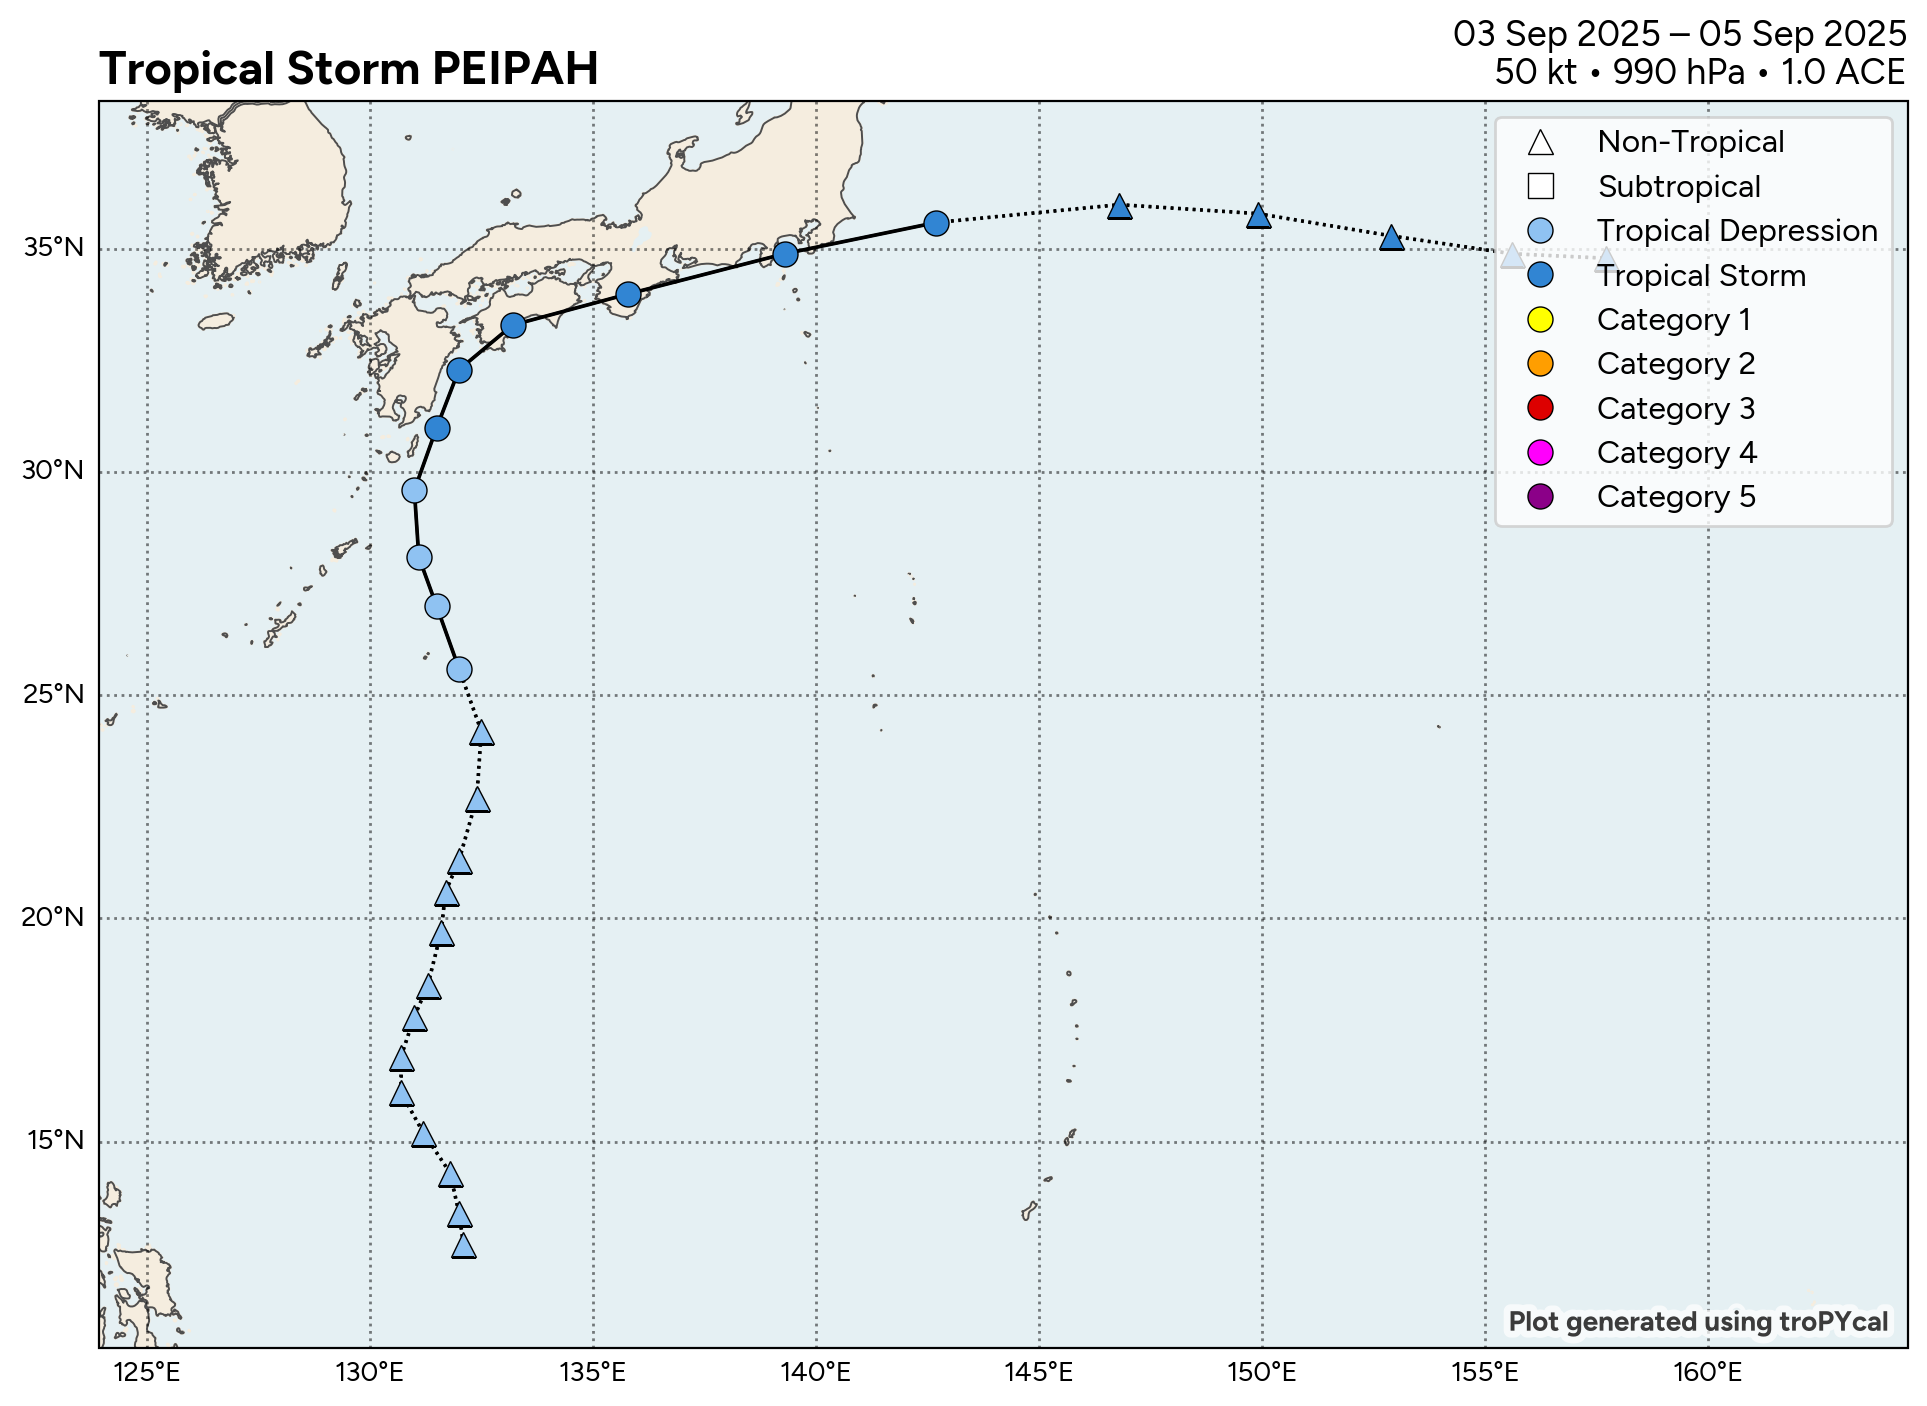
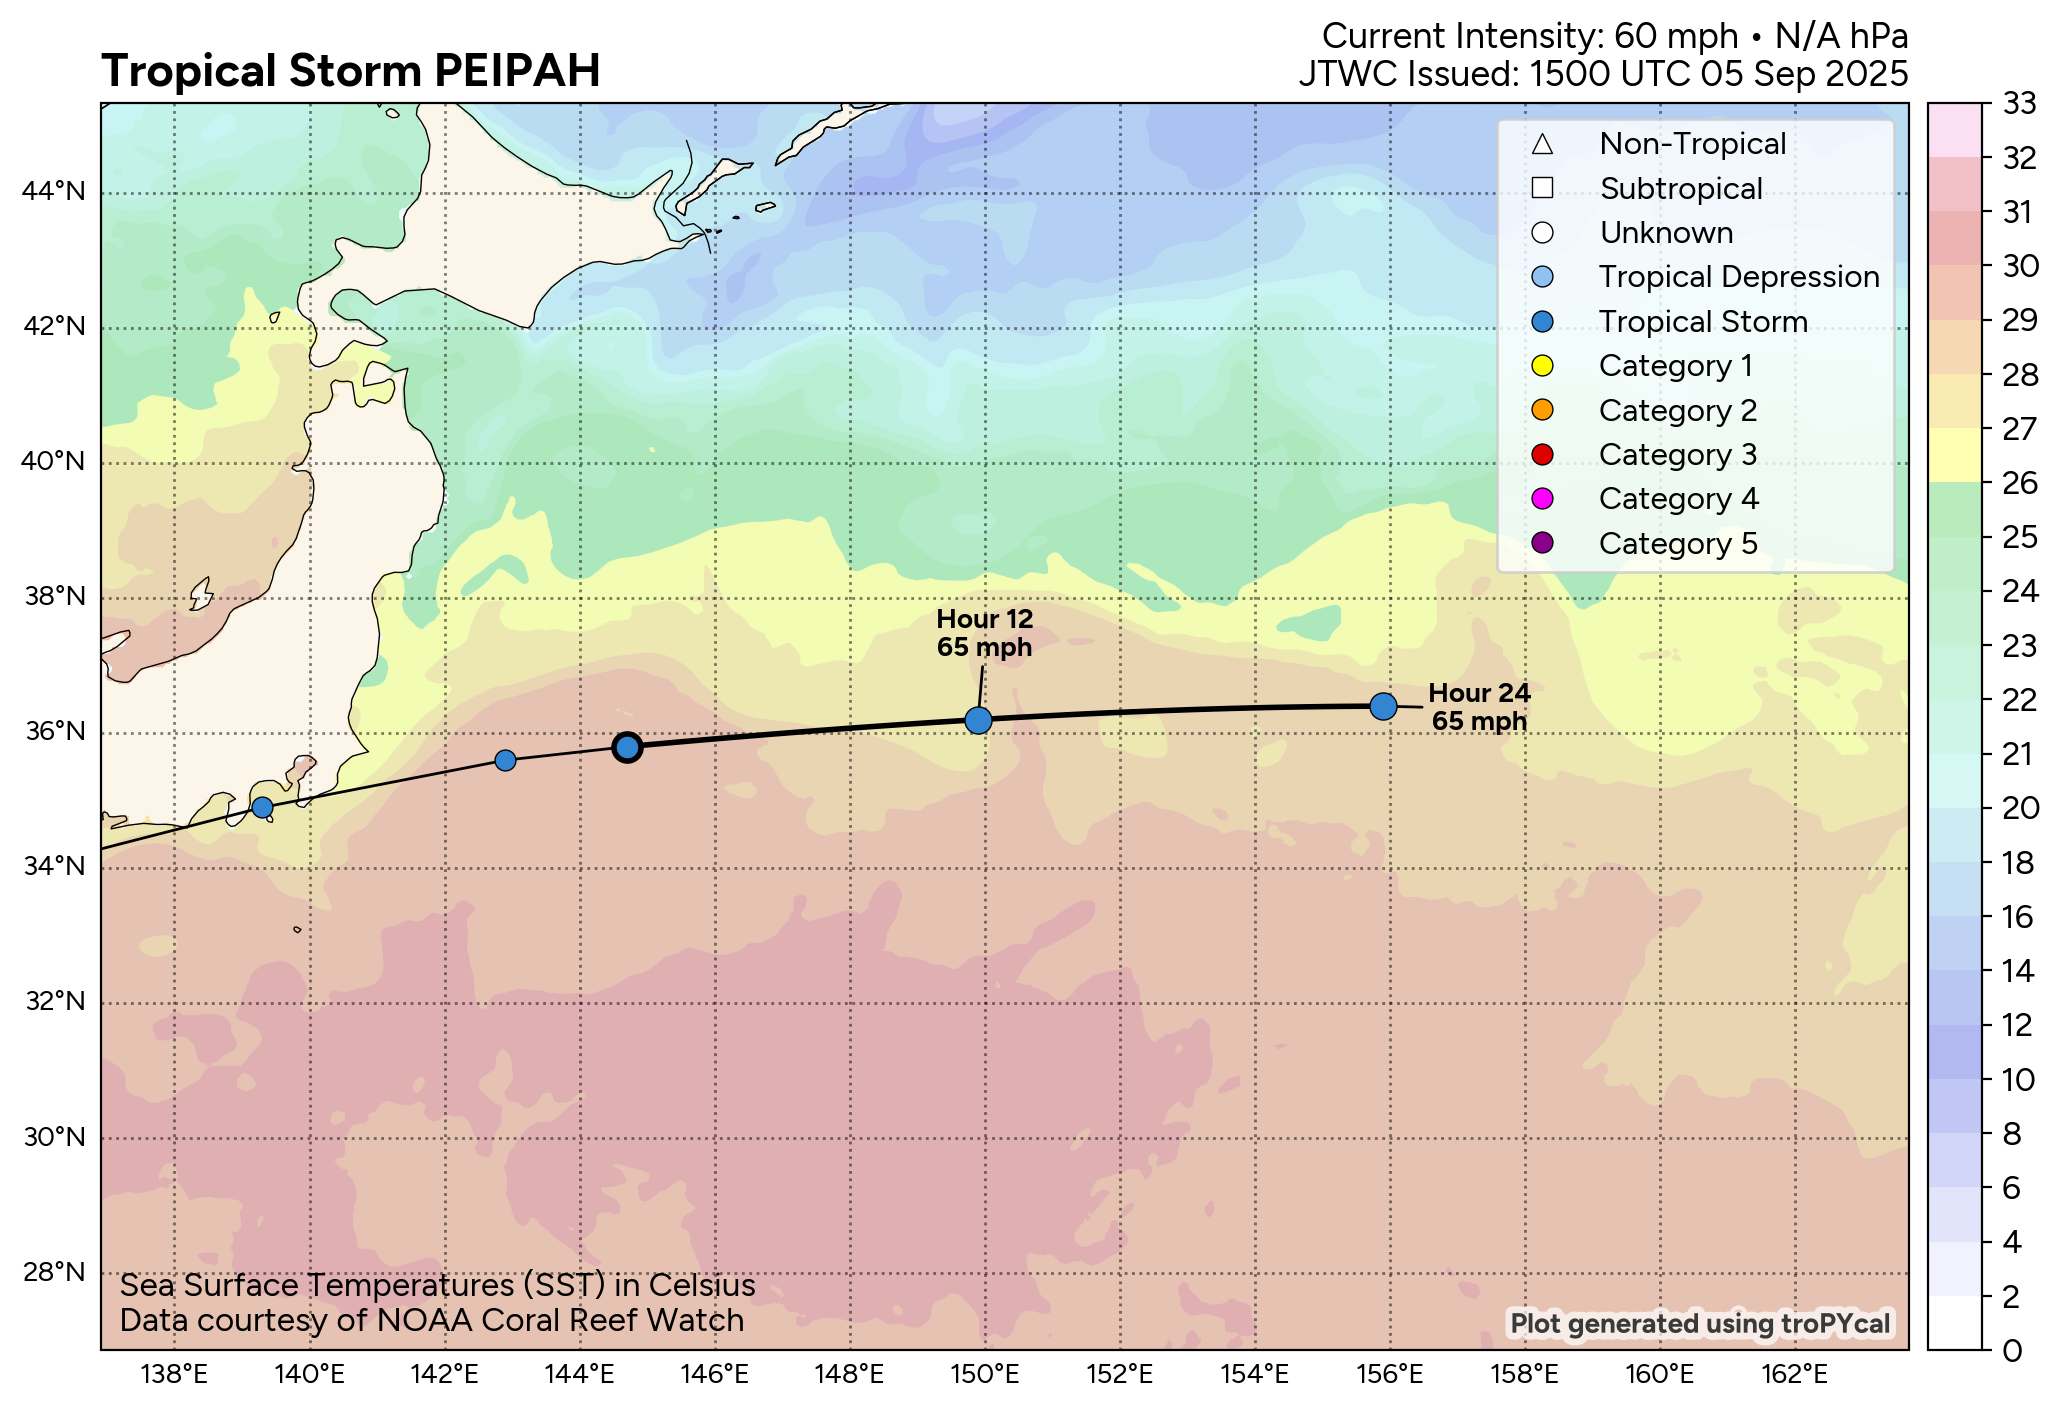
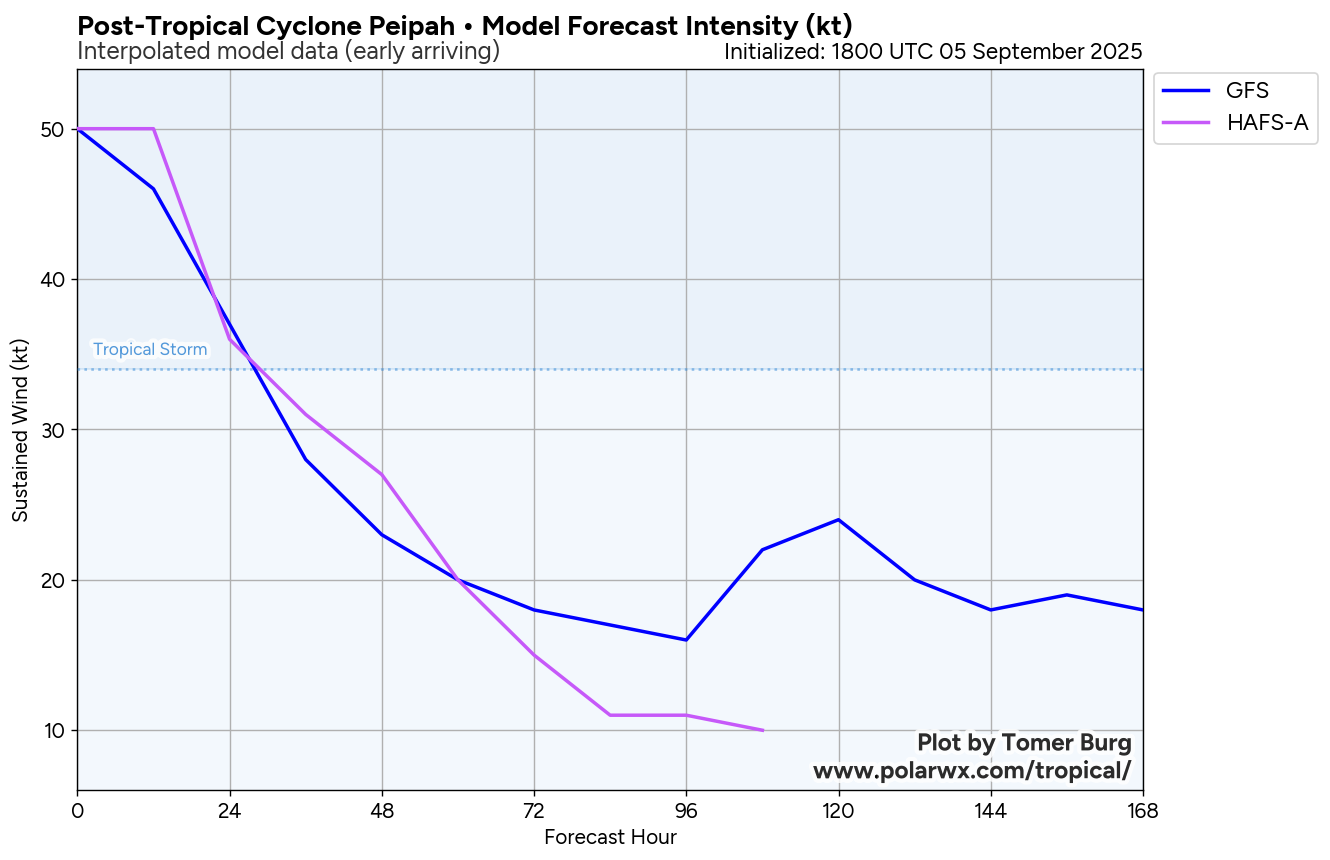
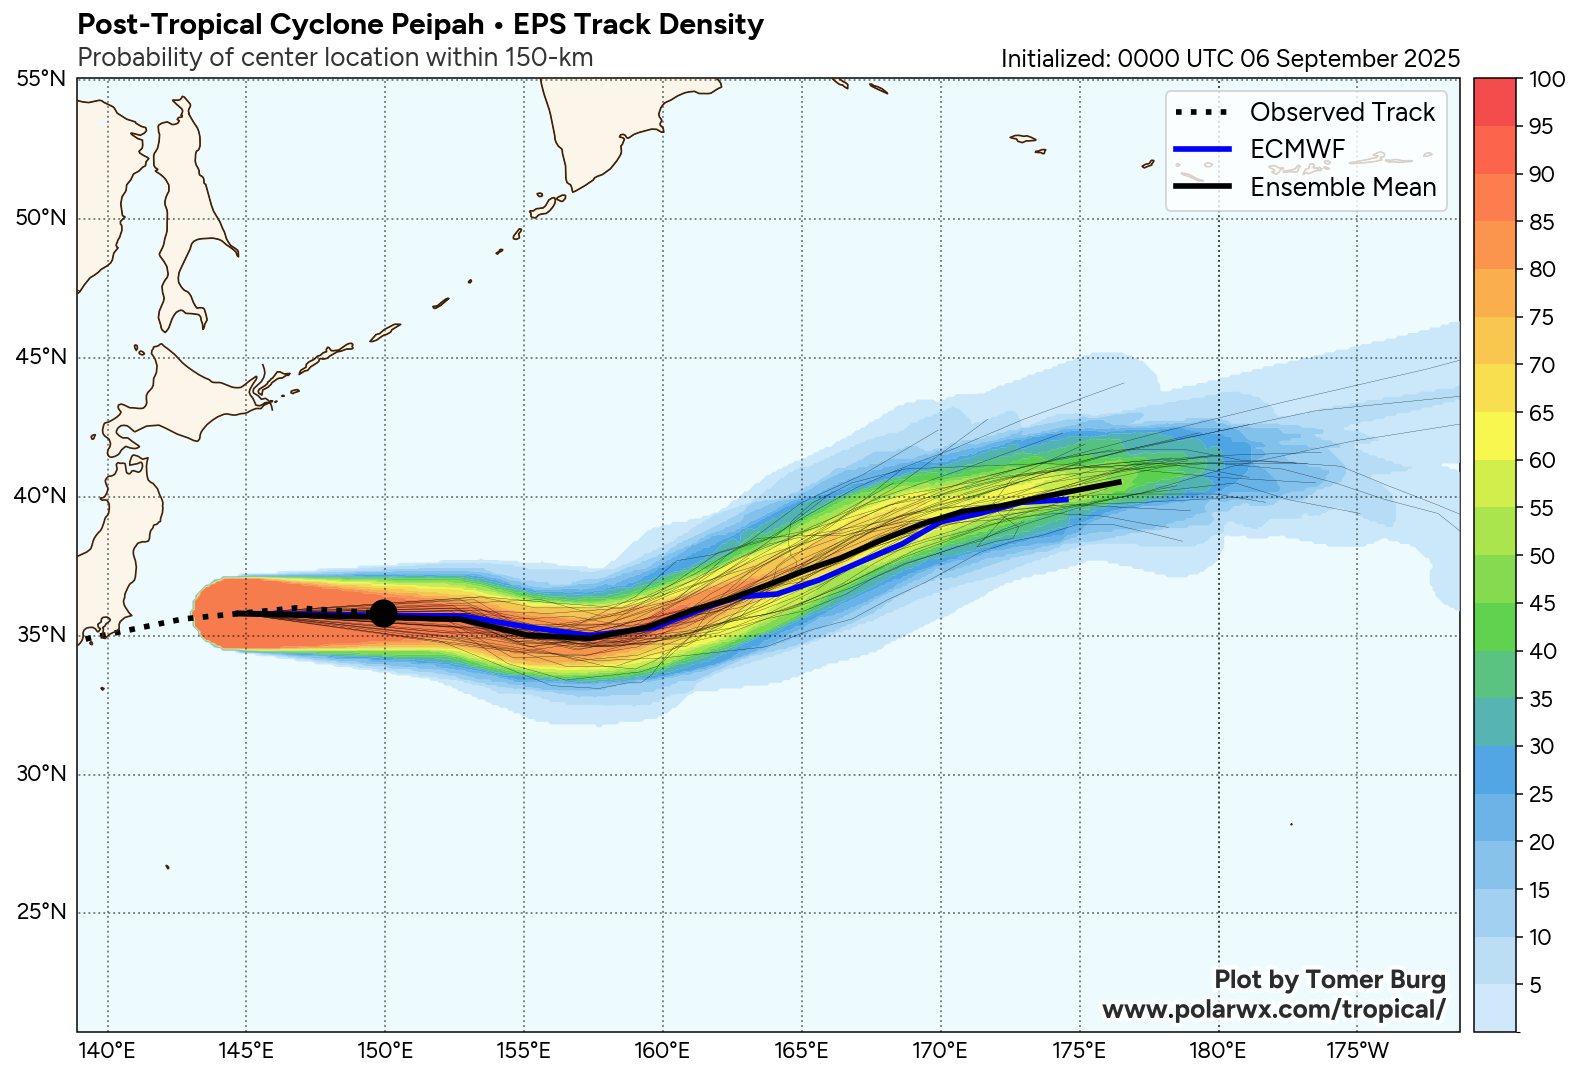
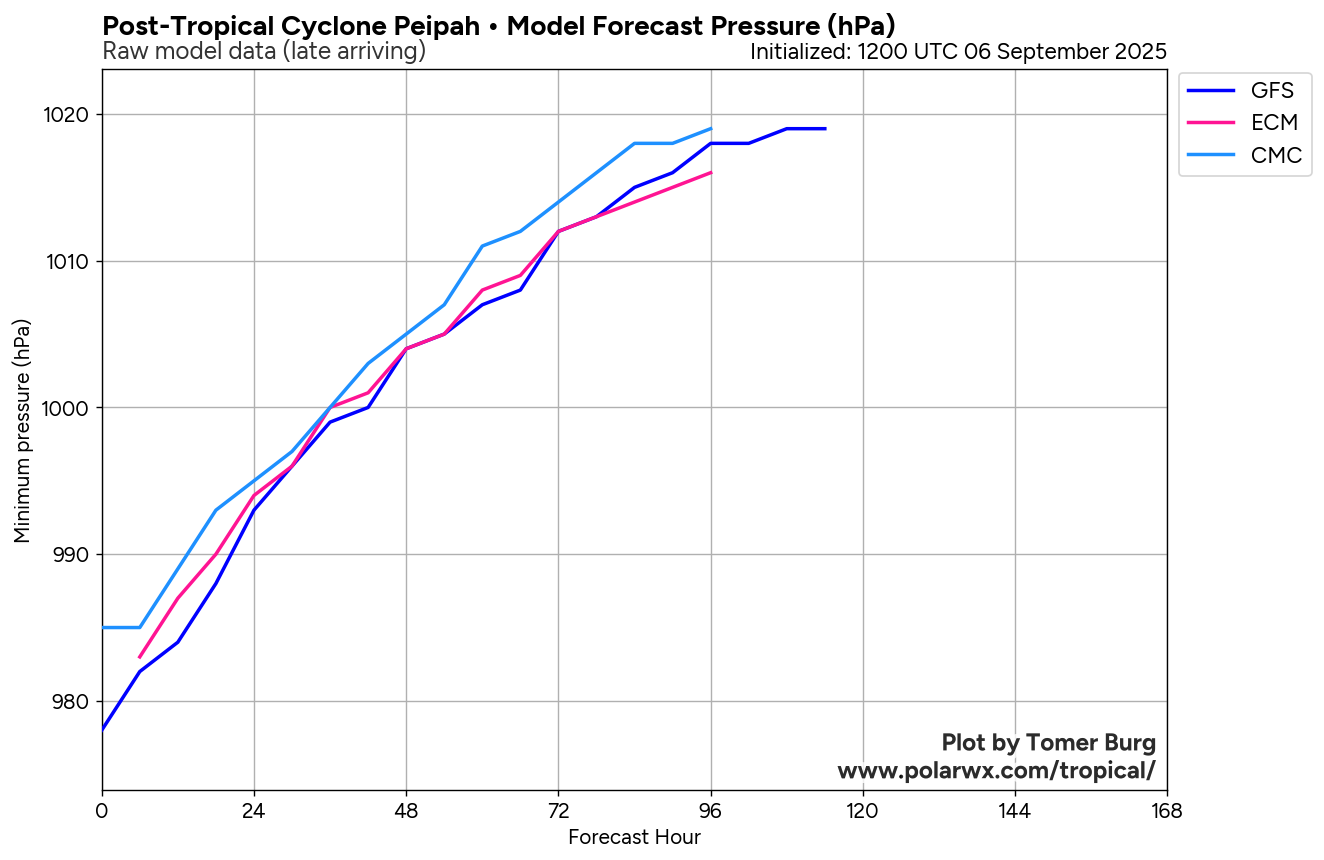
Post-Tropical Cyclone Peipah
West Pacific • 60 mph • 985 hPa
I
Invest 92S
South Indian • 20 mph • 1009 hPa
I
Invest 91L
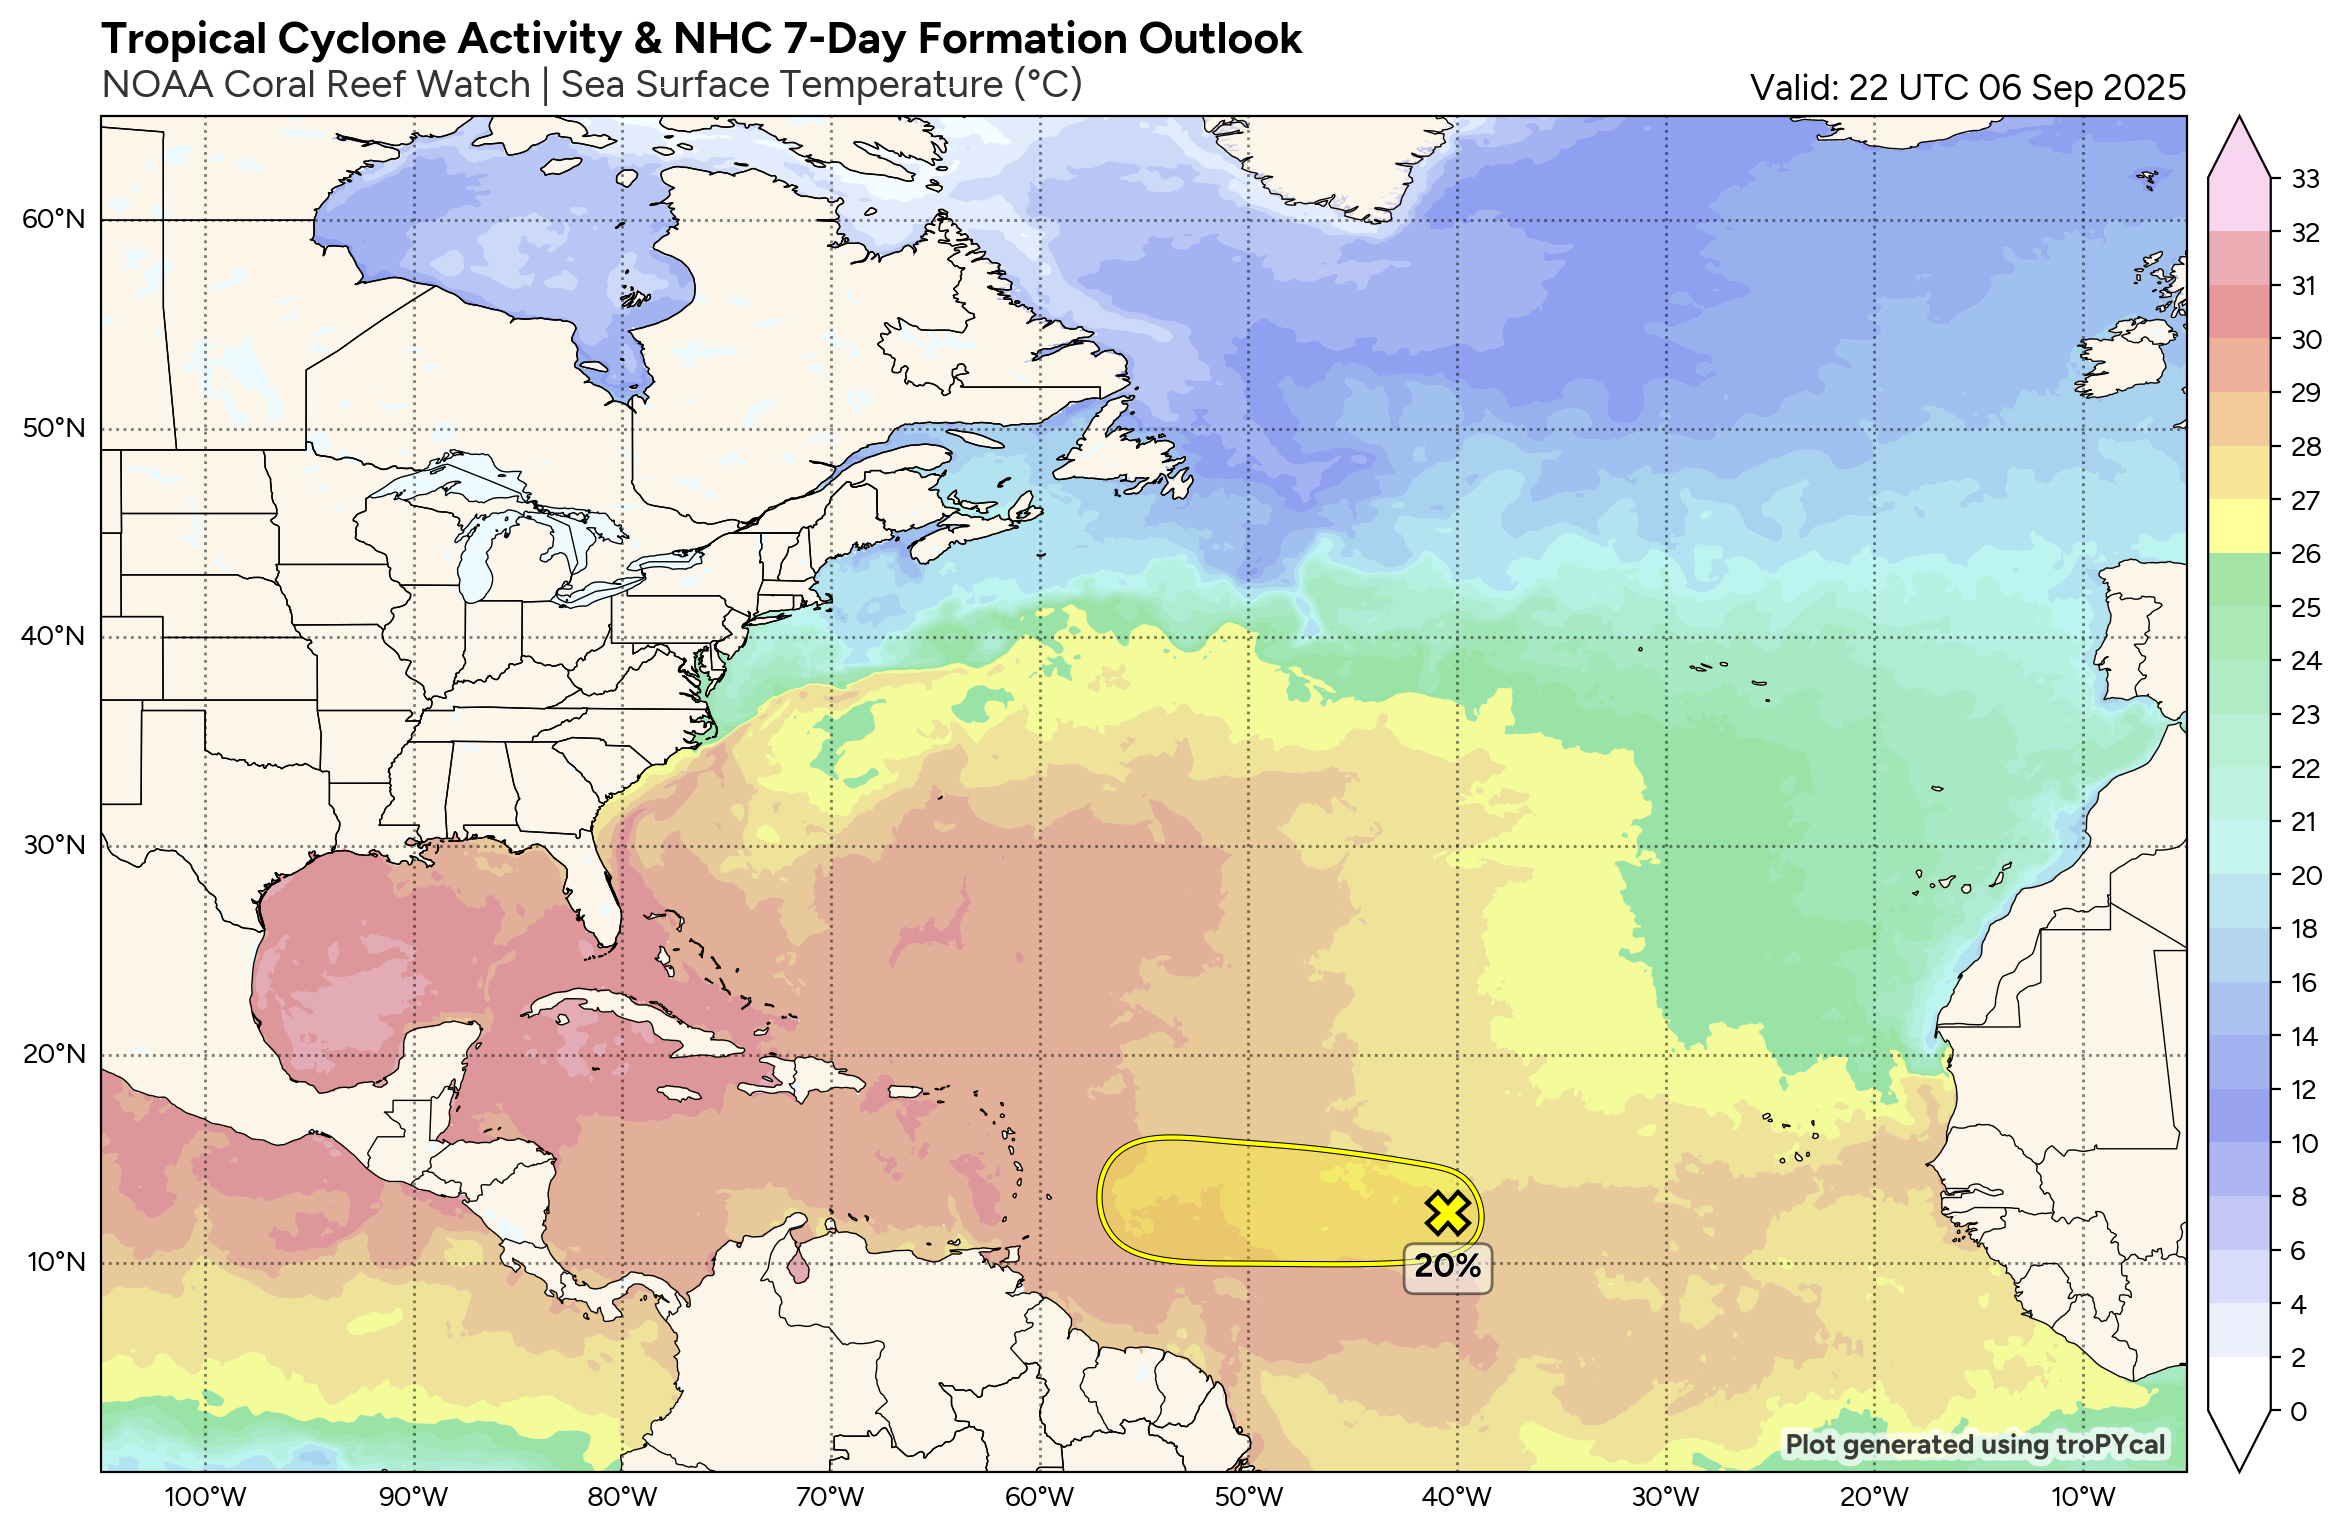
North Atlantic • 30 mph • 1011 hPa
North Atlantic
East Pacific
West Pacific
North Indian
World
Max Wind
Min Pres
Movement
Select Another Storm
LATEST STORM INFORMATION
Track History
View a more detailed breakdown of the past track of this storm.
View Track History
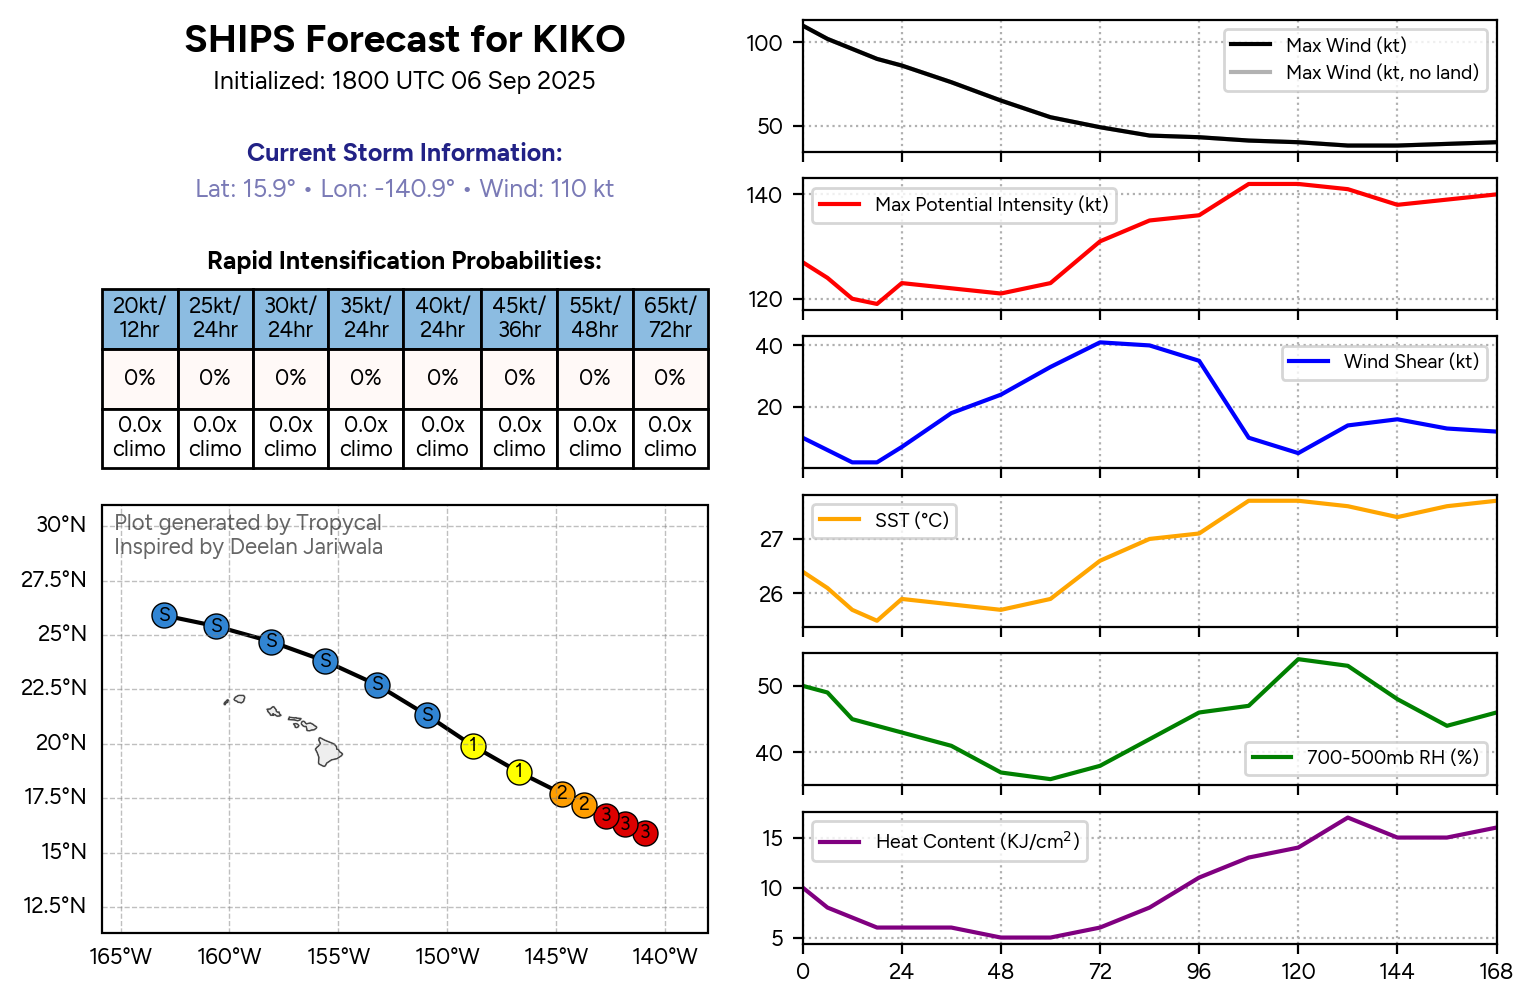
Storm Forecast
View the forecast for this storm and NHC forecast statistics if available.
View Forecast
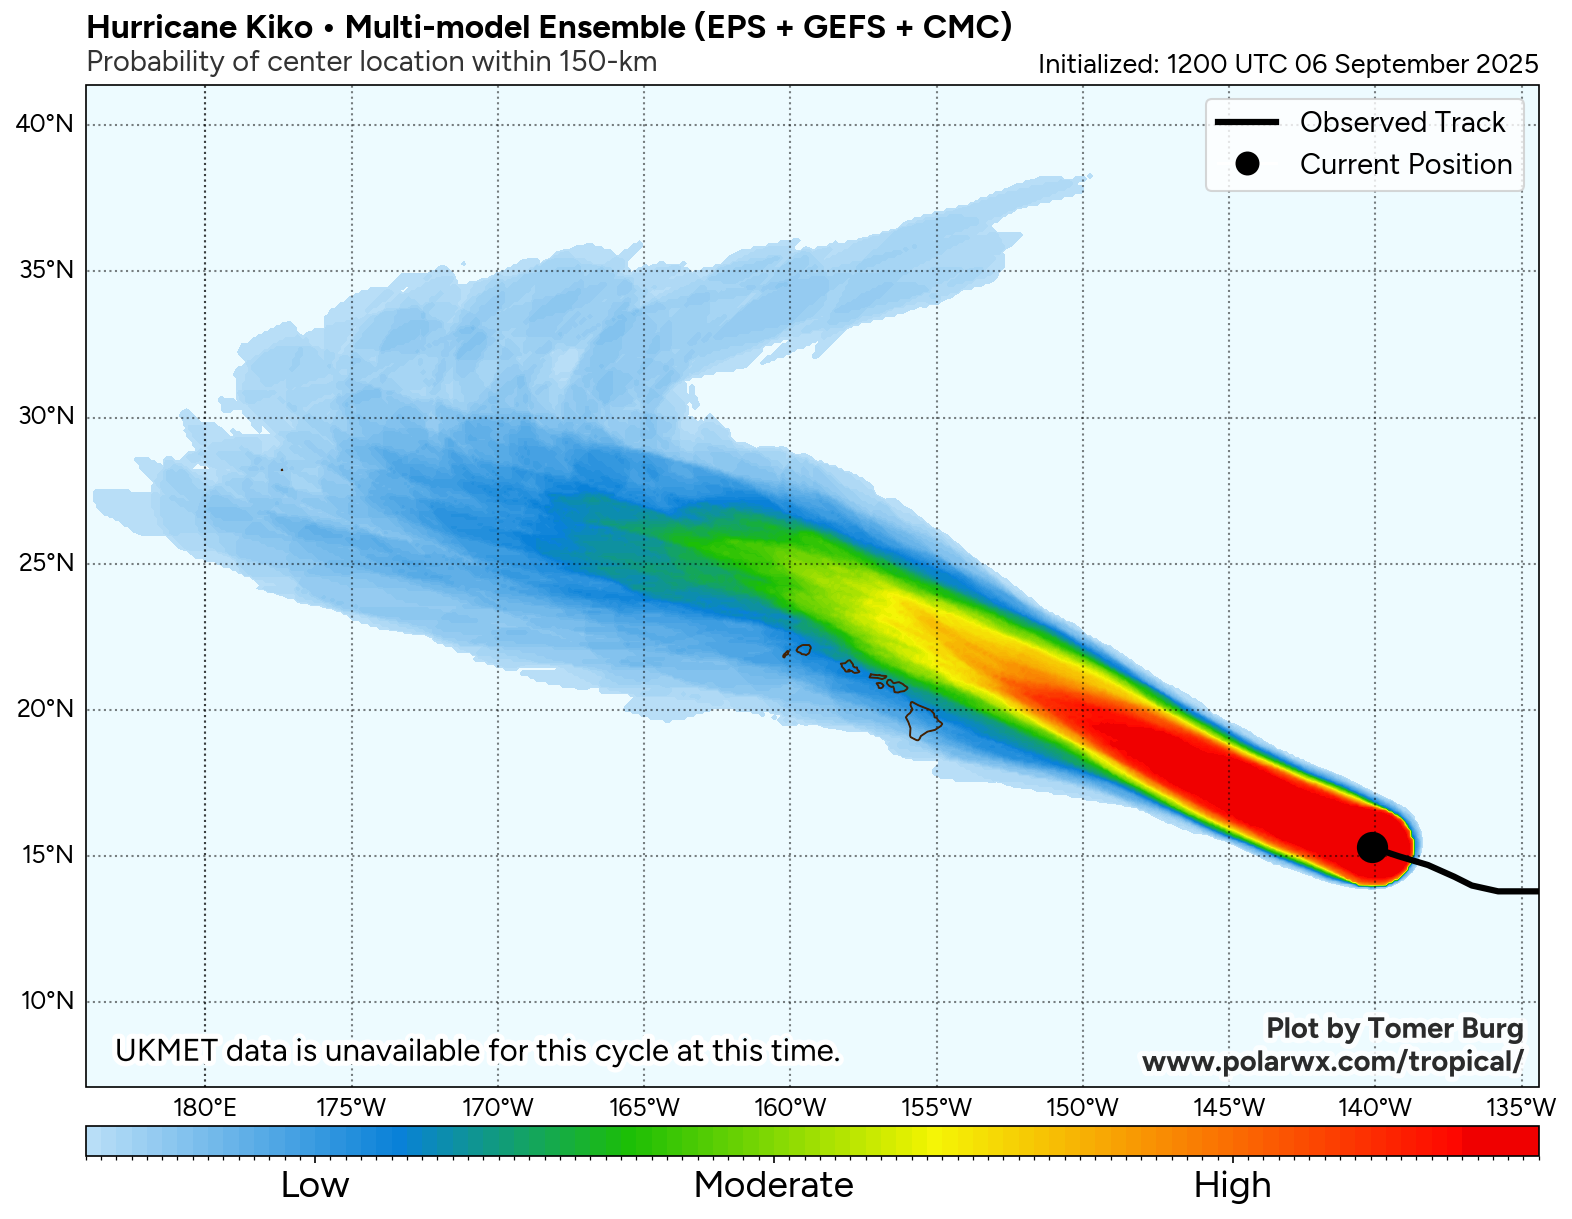
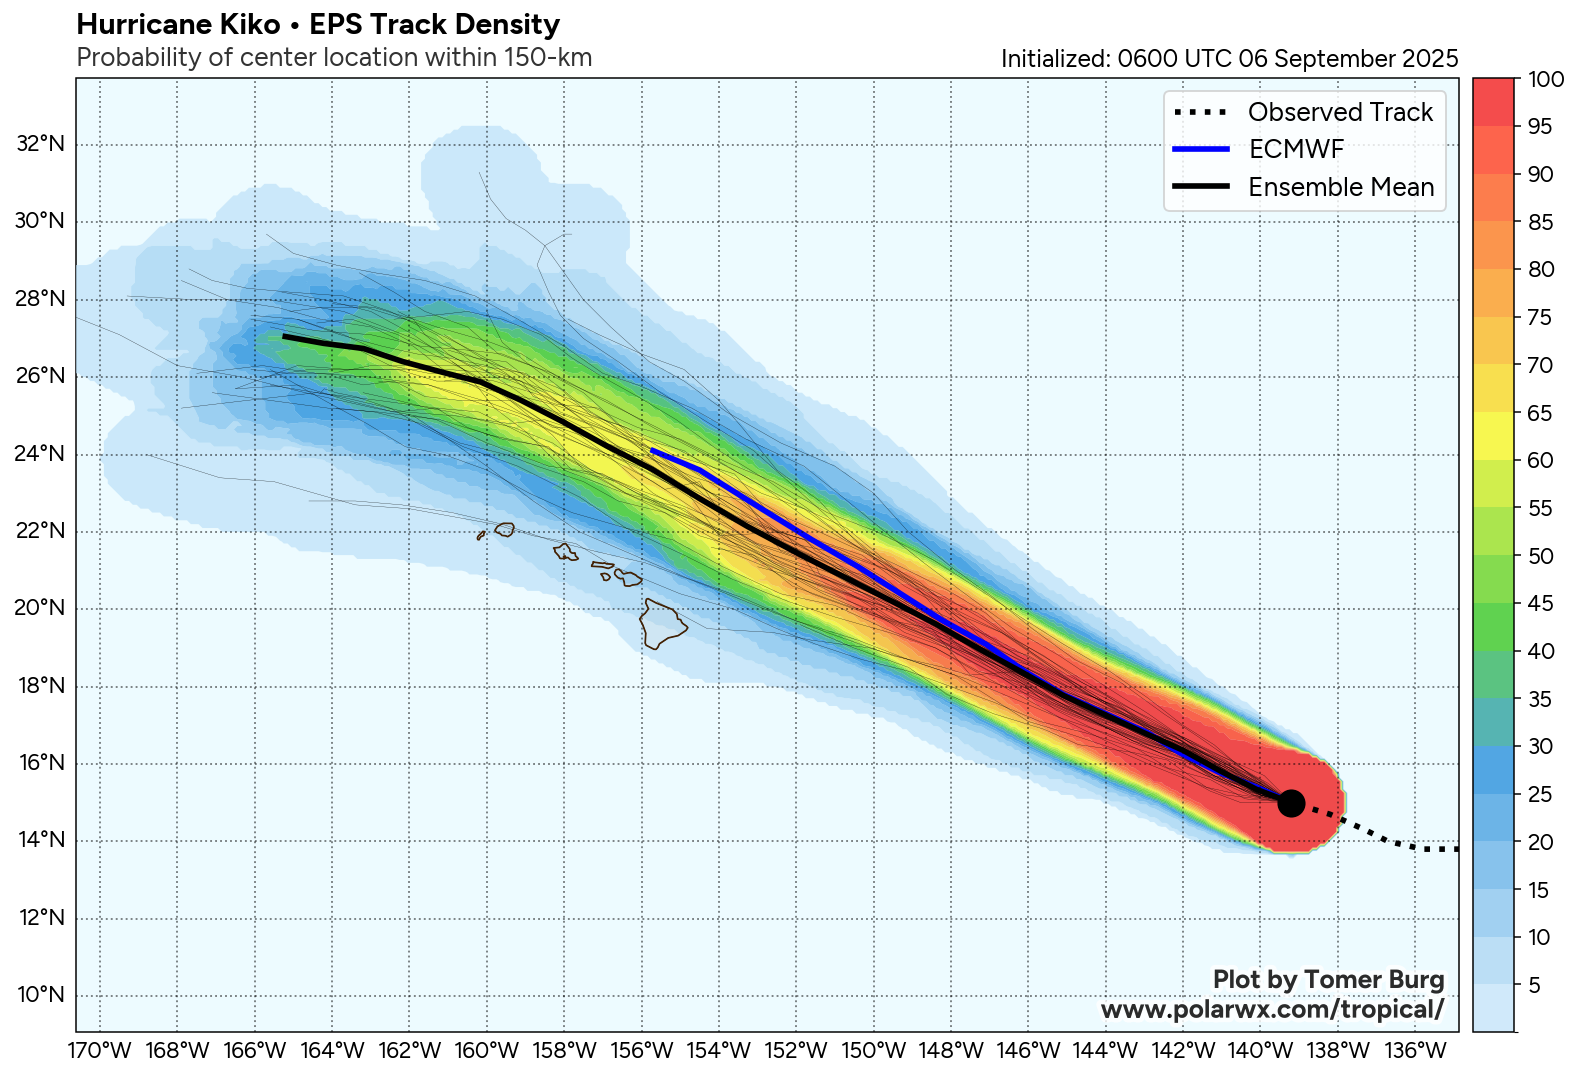
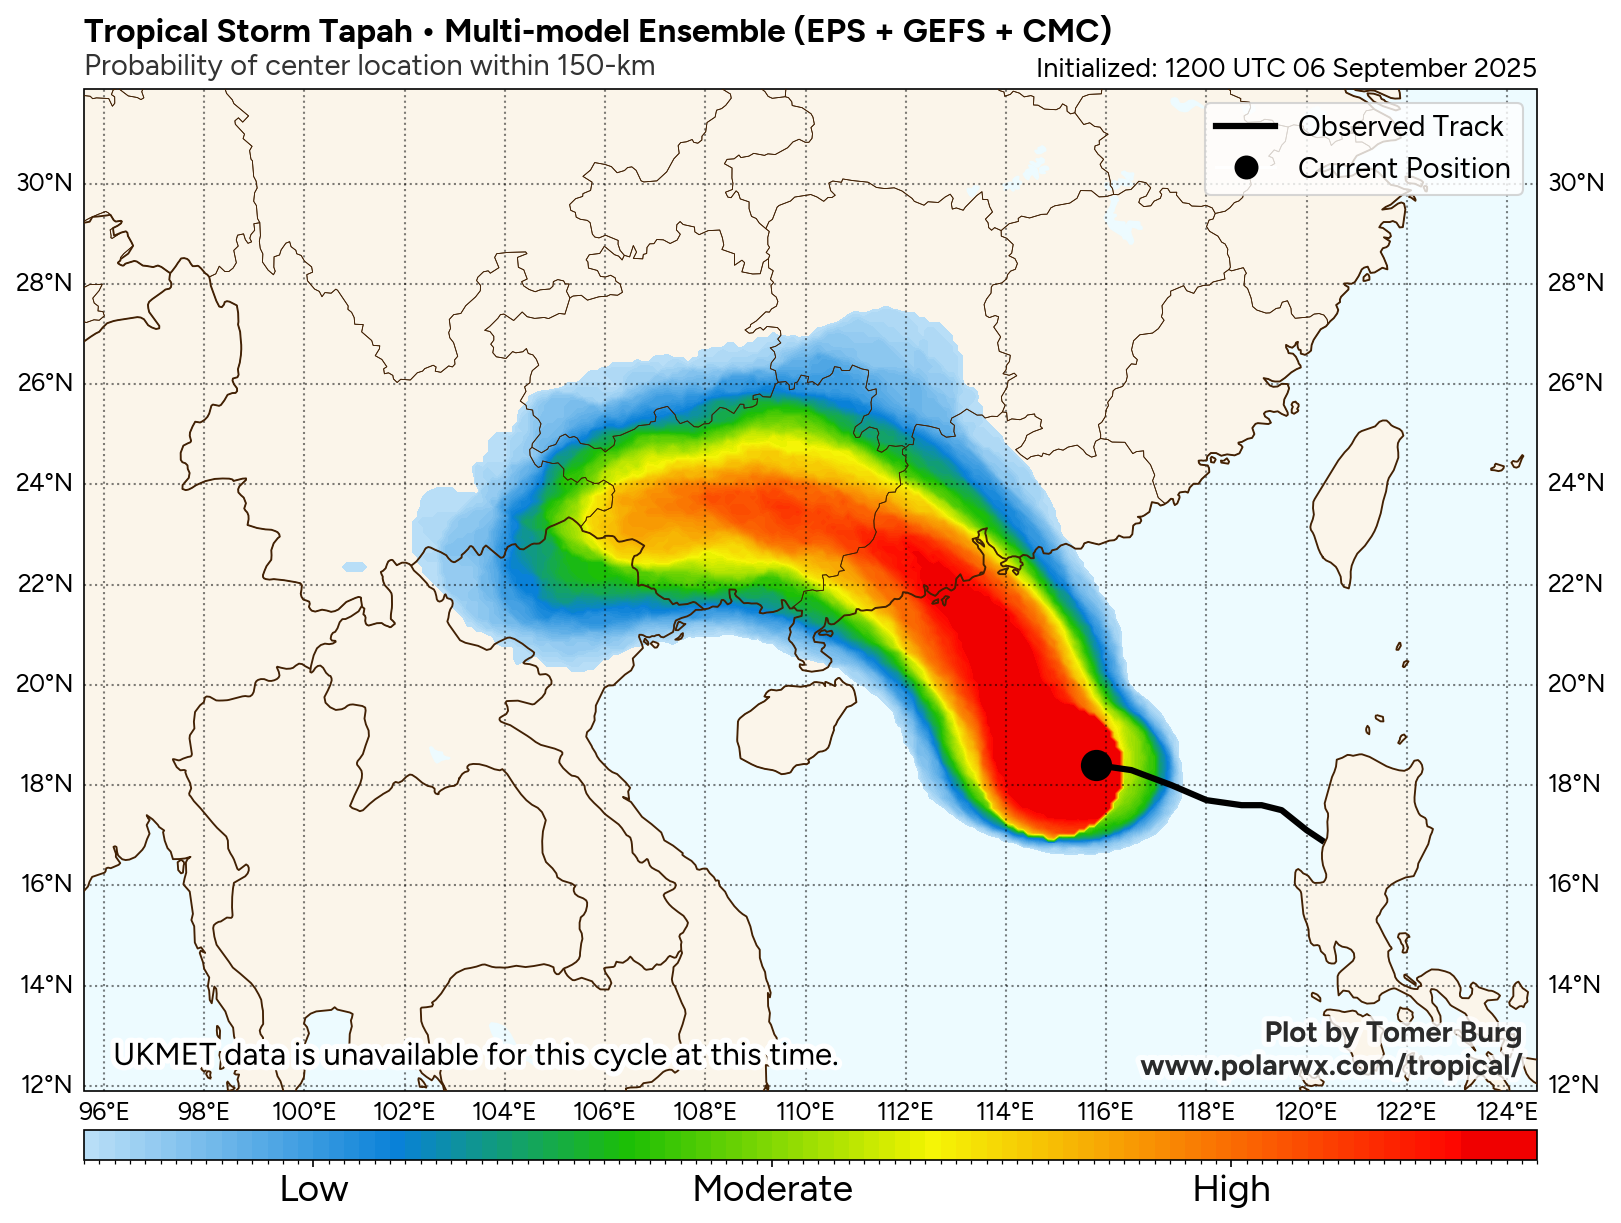
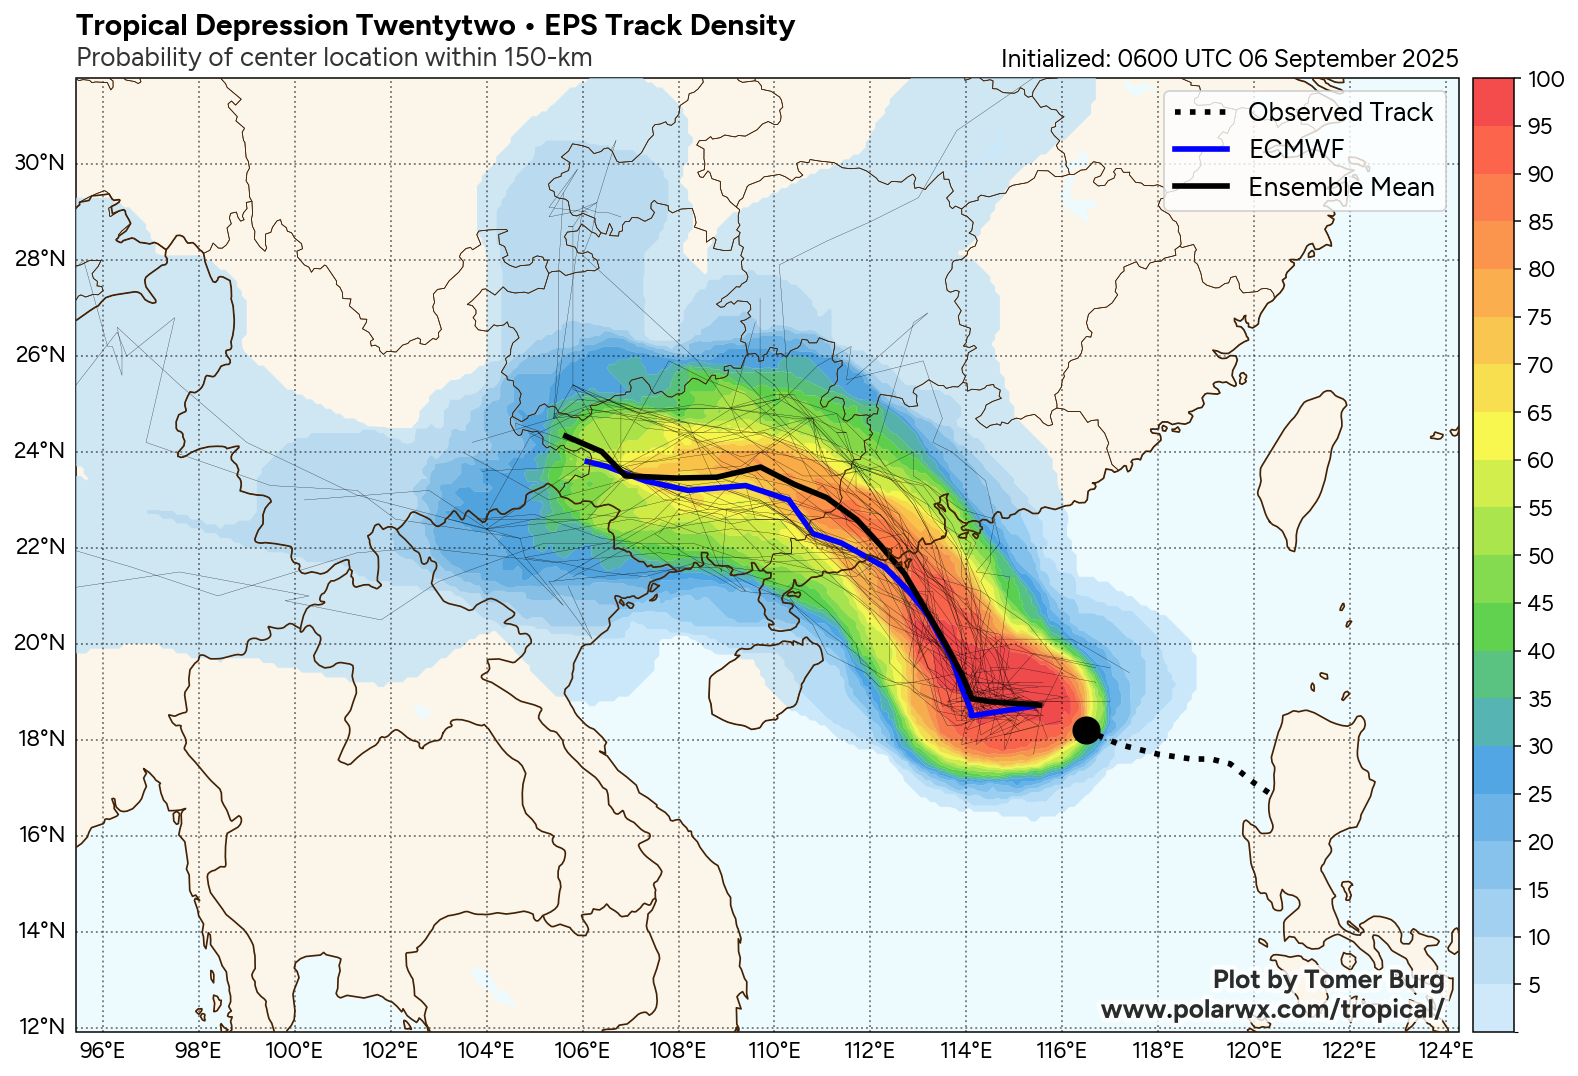
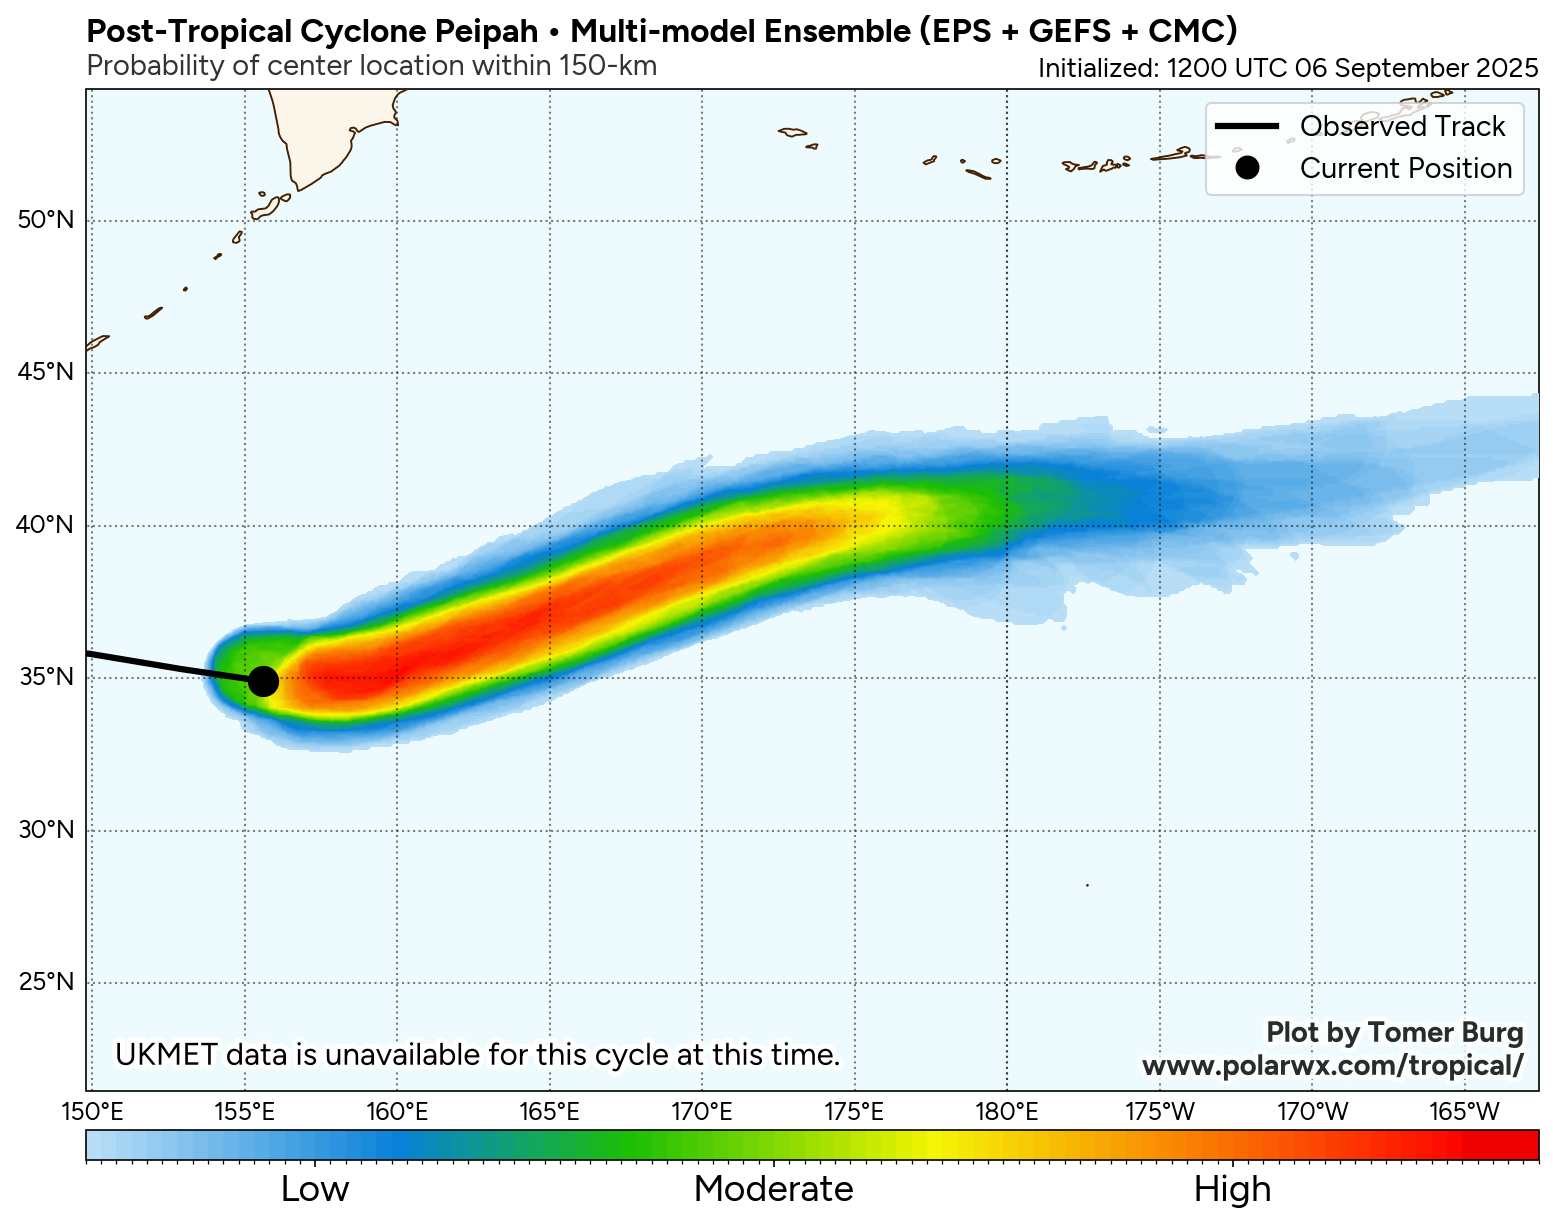
SUPER-ENSEMBLE GUIDANCE
Density
Trend
View the latest probabilistic forecast from this multi-model ensemble consisting of 4 different ensemble suites:
Superensemble Home Page
Interactive Data Viewer
Ensemble Correlation Matrix
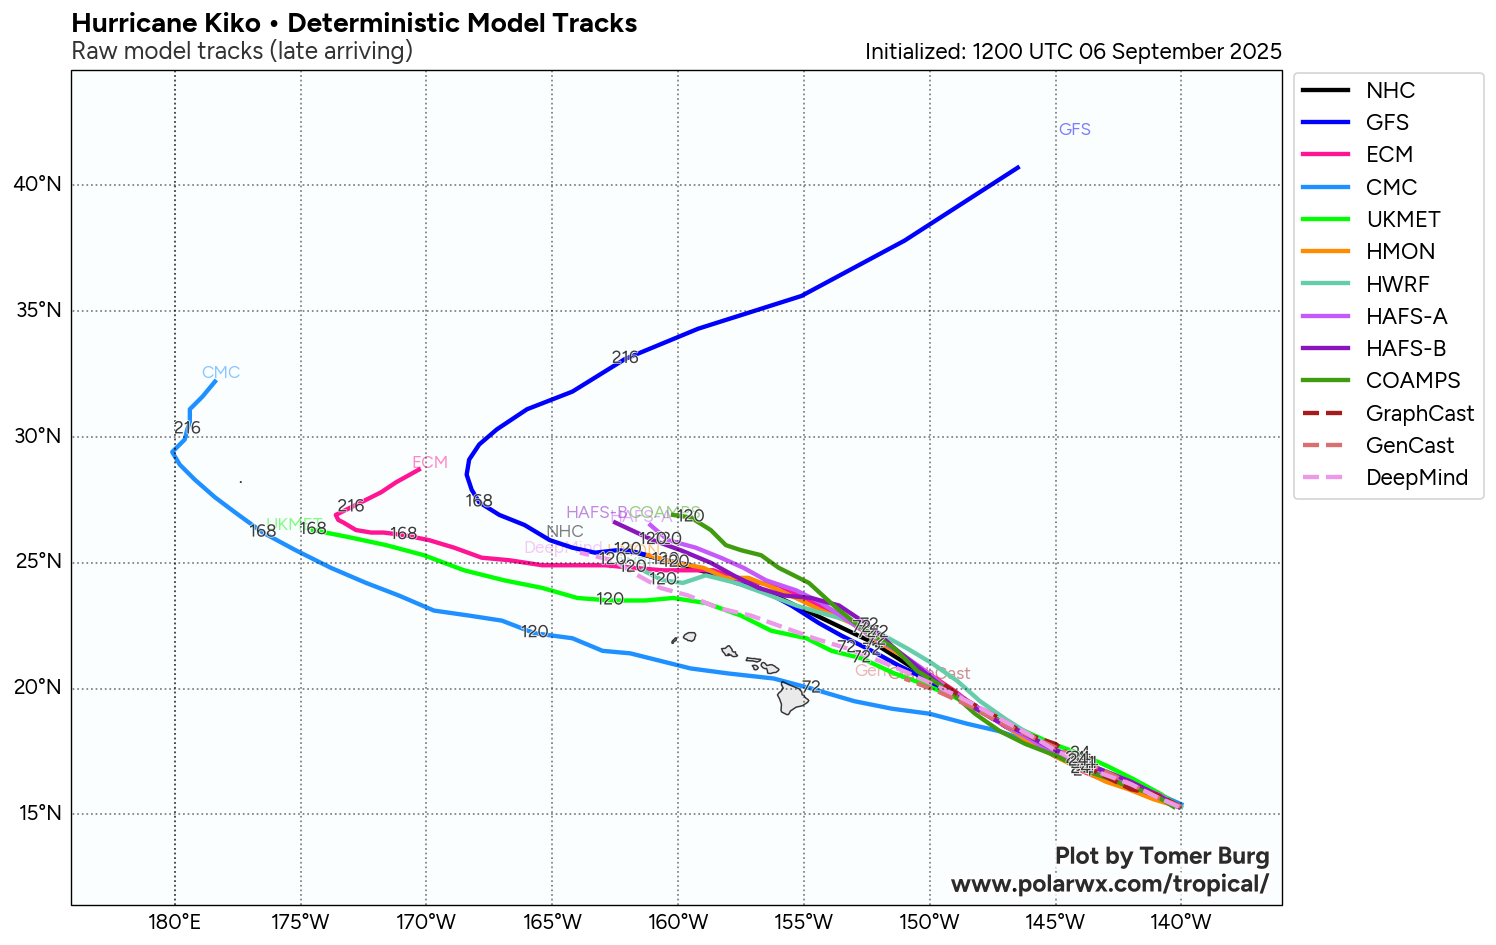
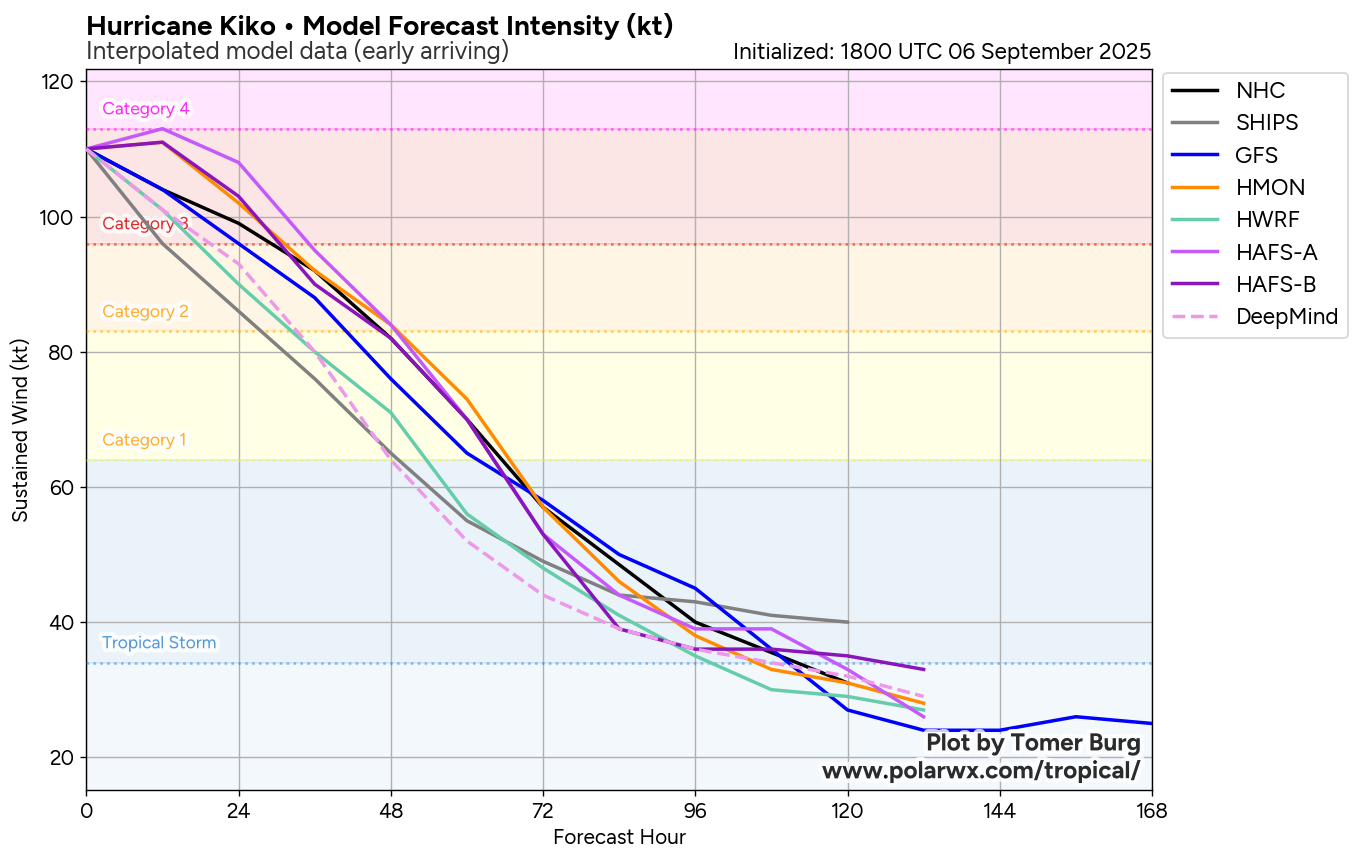
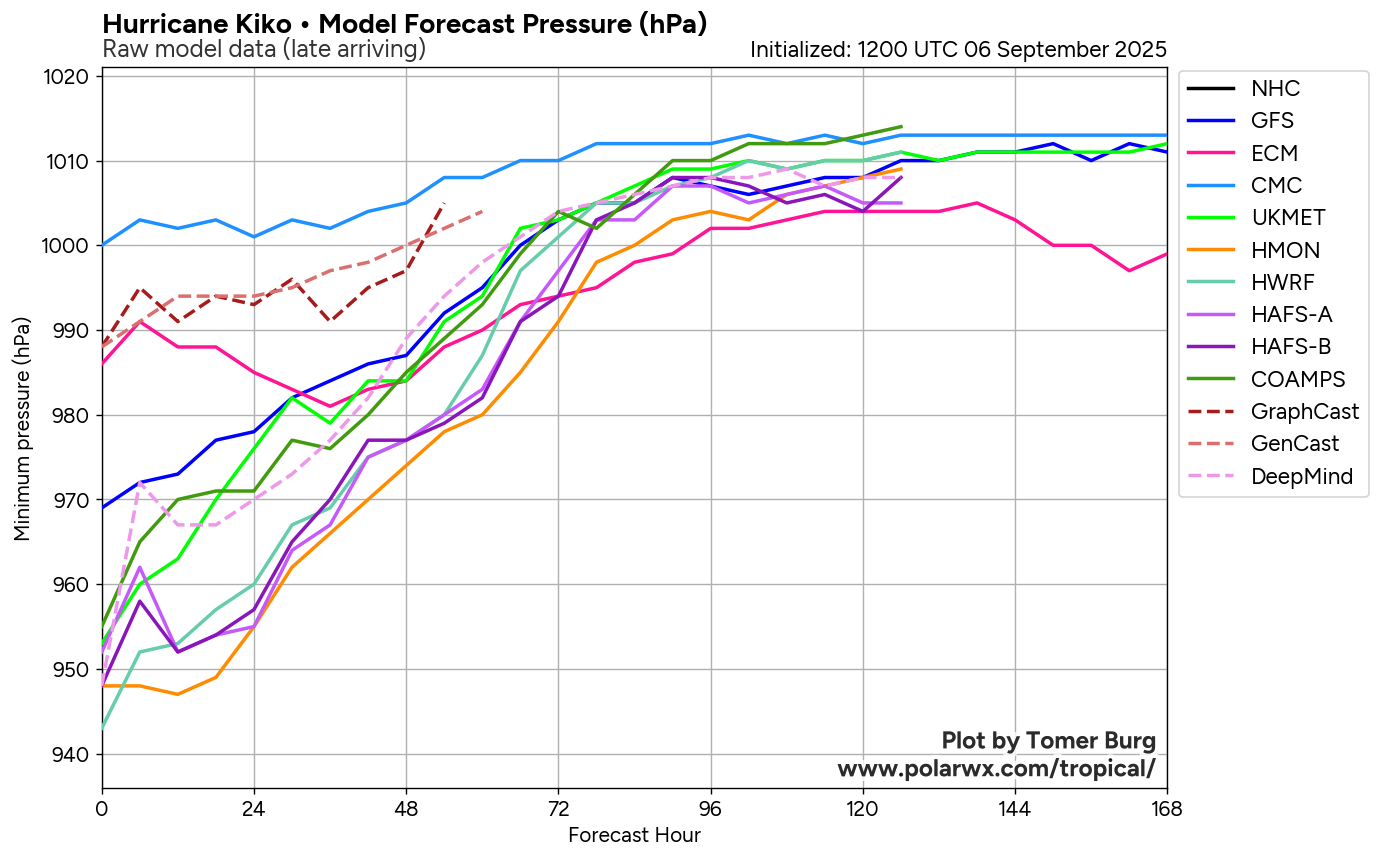
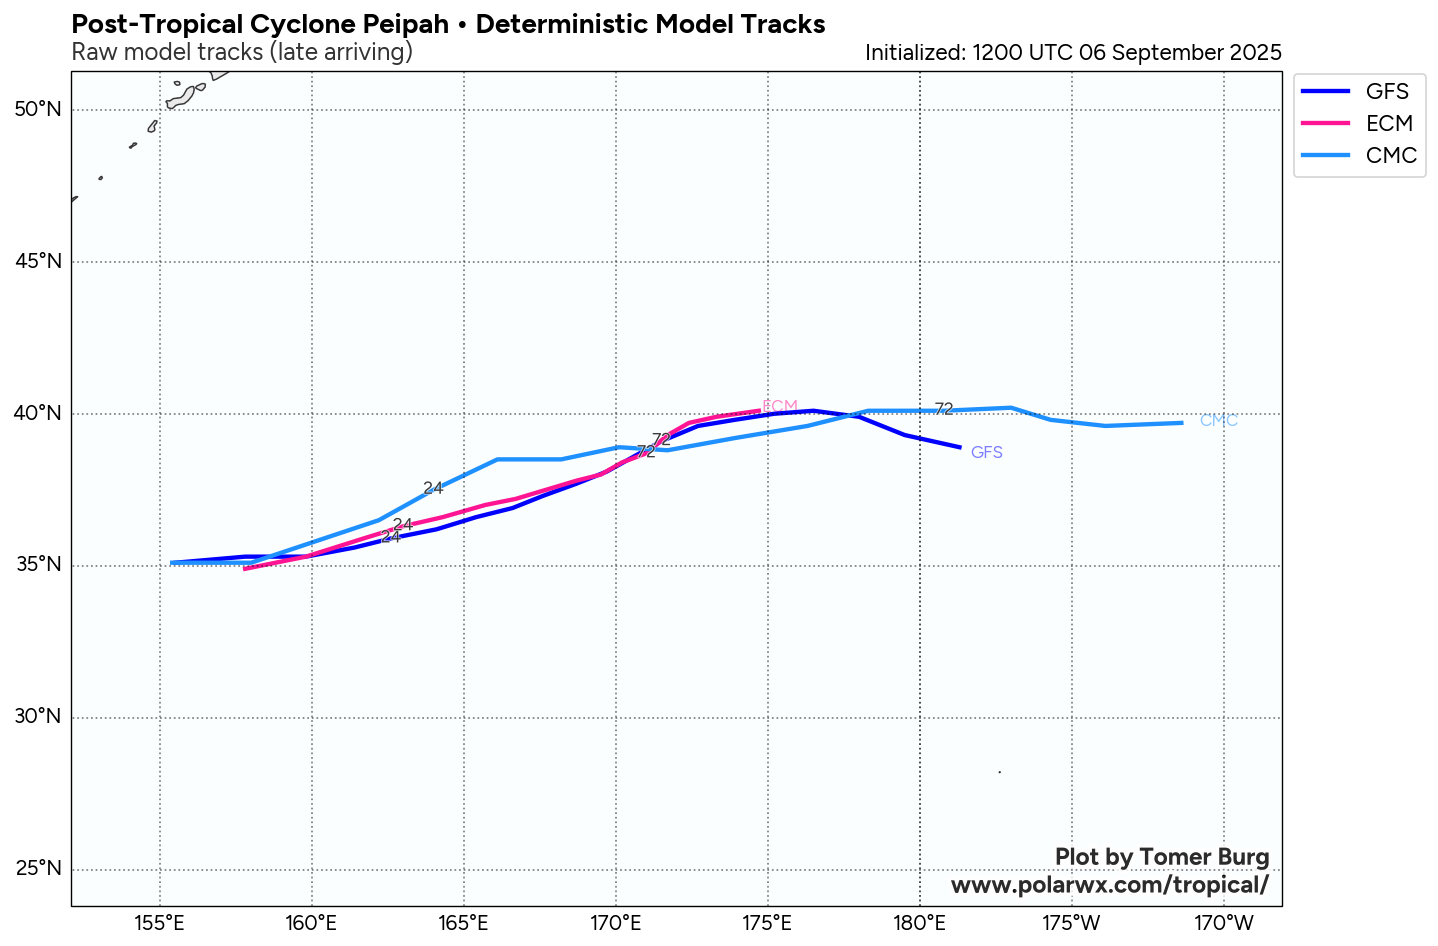
MODEL FORECASTS
Raw
Interpolated
Wind
MSLP
ENSEMBLE FORECASTS
EPS
GEFS
CMC
DeepMind
View and compare multiple ensemble suites for forecast track and intensity:
Climatology: 2000-2024 East Pacific NHC forecast 24-hour wind change (over water only)
Hours
Change
Percentile Rank
0–24 hr
–10 kt
≤ 25th Percentile
12–36 hr
–10 kt
≤ 25th Percentile
24–48 hr
–15 kt
≤ 25th Percentile
48–72 hr
–25 kt
≤ 2.5th Percentile
72–96 hr
–20 kt
≤ 10th Percentile
96–120 hr
–10 kt
Normal Range
Climatology: 2000-2024 East Pacific NHC forecast 24-hour wind change based off forecast wind speed at the start of the 24-hour period (over water only, smaller sample size)
Hours
Start Wind
End Wind
Percentile Rank
0–24 hr
115 kt
105 kt
Normal Range
12–36 hr
110 kt
100 kt
Normal Range
24–48 hr
105 kt
90 kt
Normal Range
48–72 hr
90 kt
65 kt
≤ 10th Percentile
72–96 hr
65 kt
45 kt
≤ 10th Percentile
96–120 hr
45 kt
35 kt
Normal Range
Climatology: 2000-2024 East Pacific NHC forecasts initialized at 115 kt (over water only)
Hour
Forecast
Percentile Rank
24
105 kt
Normal Range
36
100 kt
Normal Range
48
90 kt
Normal Range
72
65 kt
Normal Range
96
45 kt
Normal Range
120
35 kt
Normal Range
TRACK & INTENSITY FORECASTS
Select Cycle:
Select Max Hour:
Select Track Type:
Select Track Colors:
WIND & PRESSURE FORECASTS
Select Cycle:
Select Cycle:
Coming soon!
Coming soon!
Coming soon!
LATEST STORM INFORMATION
Track History
View a more detailed breakdown of the past track of this storm.
View Track History
Storm Forecast
View the forecast for this storm and NHC forecast statistics if available.
View Forecast
SUPER-ENSEMBLE GUIDANCE
Density
Trend
View the latest probabilistic forecast from this multi-model ensemble consisting of 4 different ensemble suites:
Superensemble Home Page
Interactive Data Viewer
Ensemble Correlation Matrix
MODEL FORECASTS
Raw
Interpolated
Wind
MSLP
ENSEMBLE FORECASTS
EPS
GEFS
CMC
DeepMind
View and compare multiple ensemble suites for forecast track and intensity: