A Detailed Look at the September Nor'easter
Early last week, the Northeast US and Mid Atlantic were affected by an unusually early nor'easter producing significant rainfall and coastal flooding. This post digs deeper into its meteorological history, why it wasn't classified as a tropical cyclone, and forecast communication challenges.
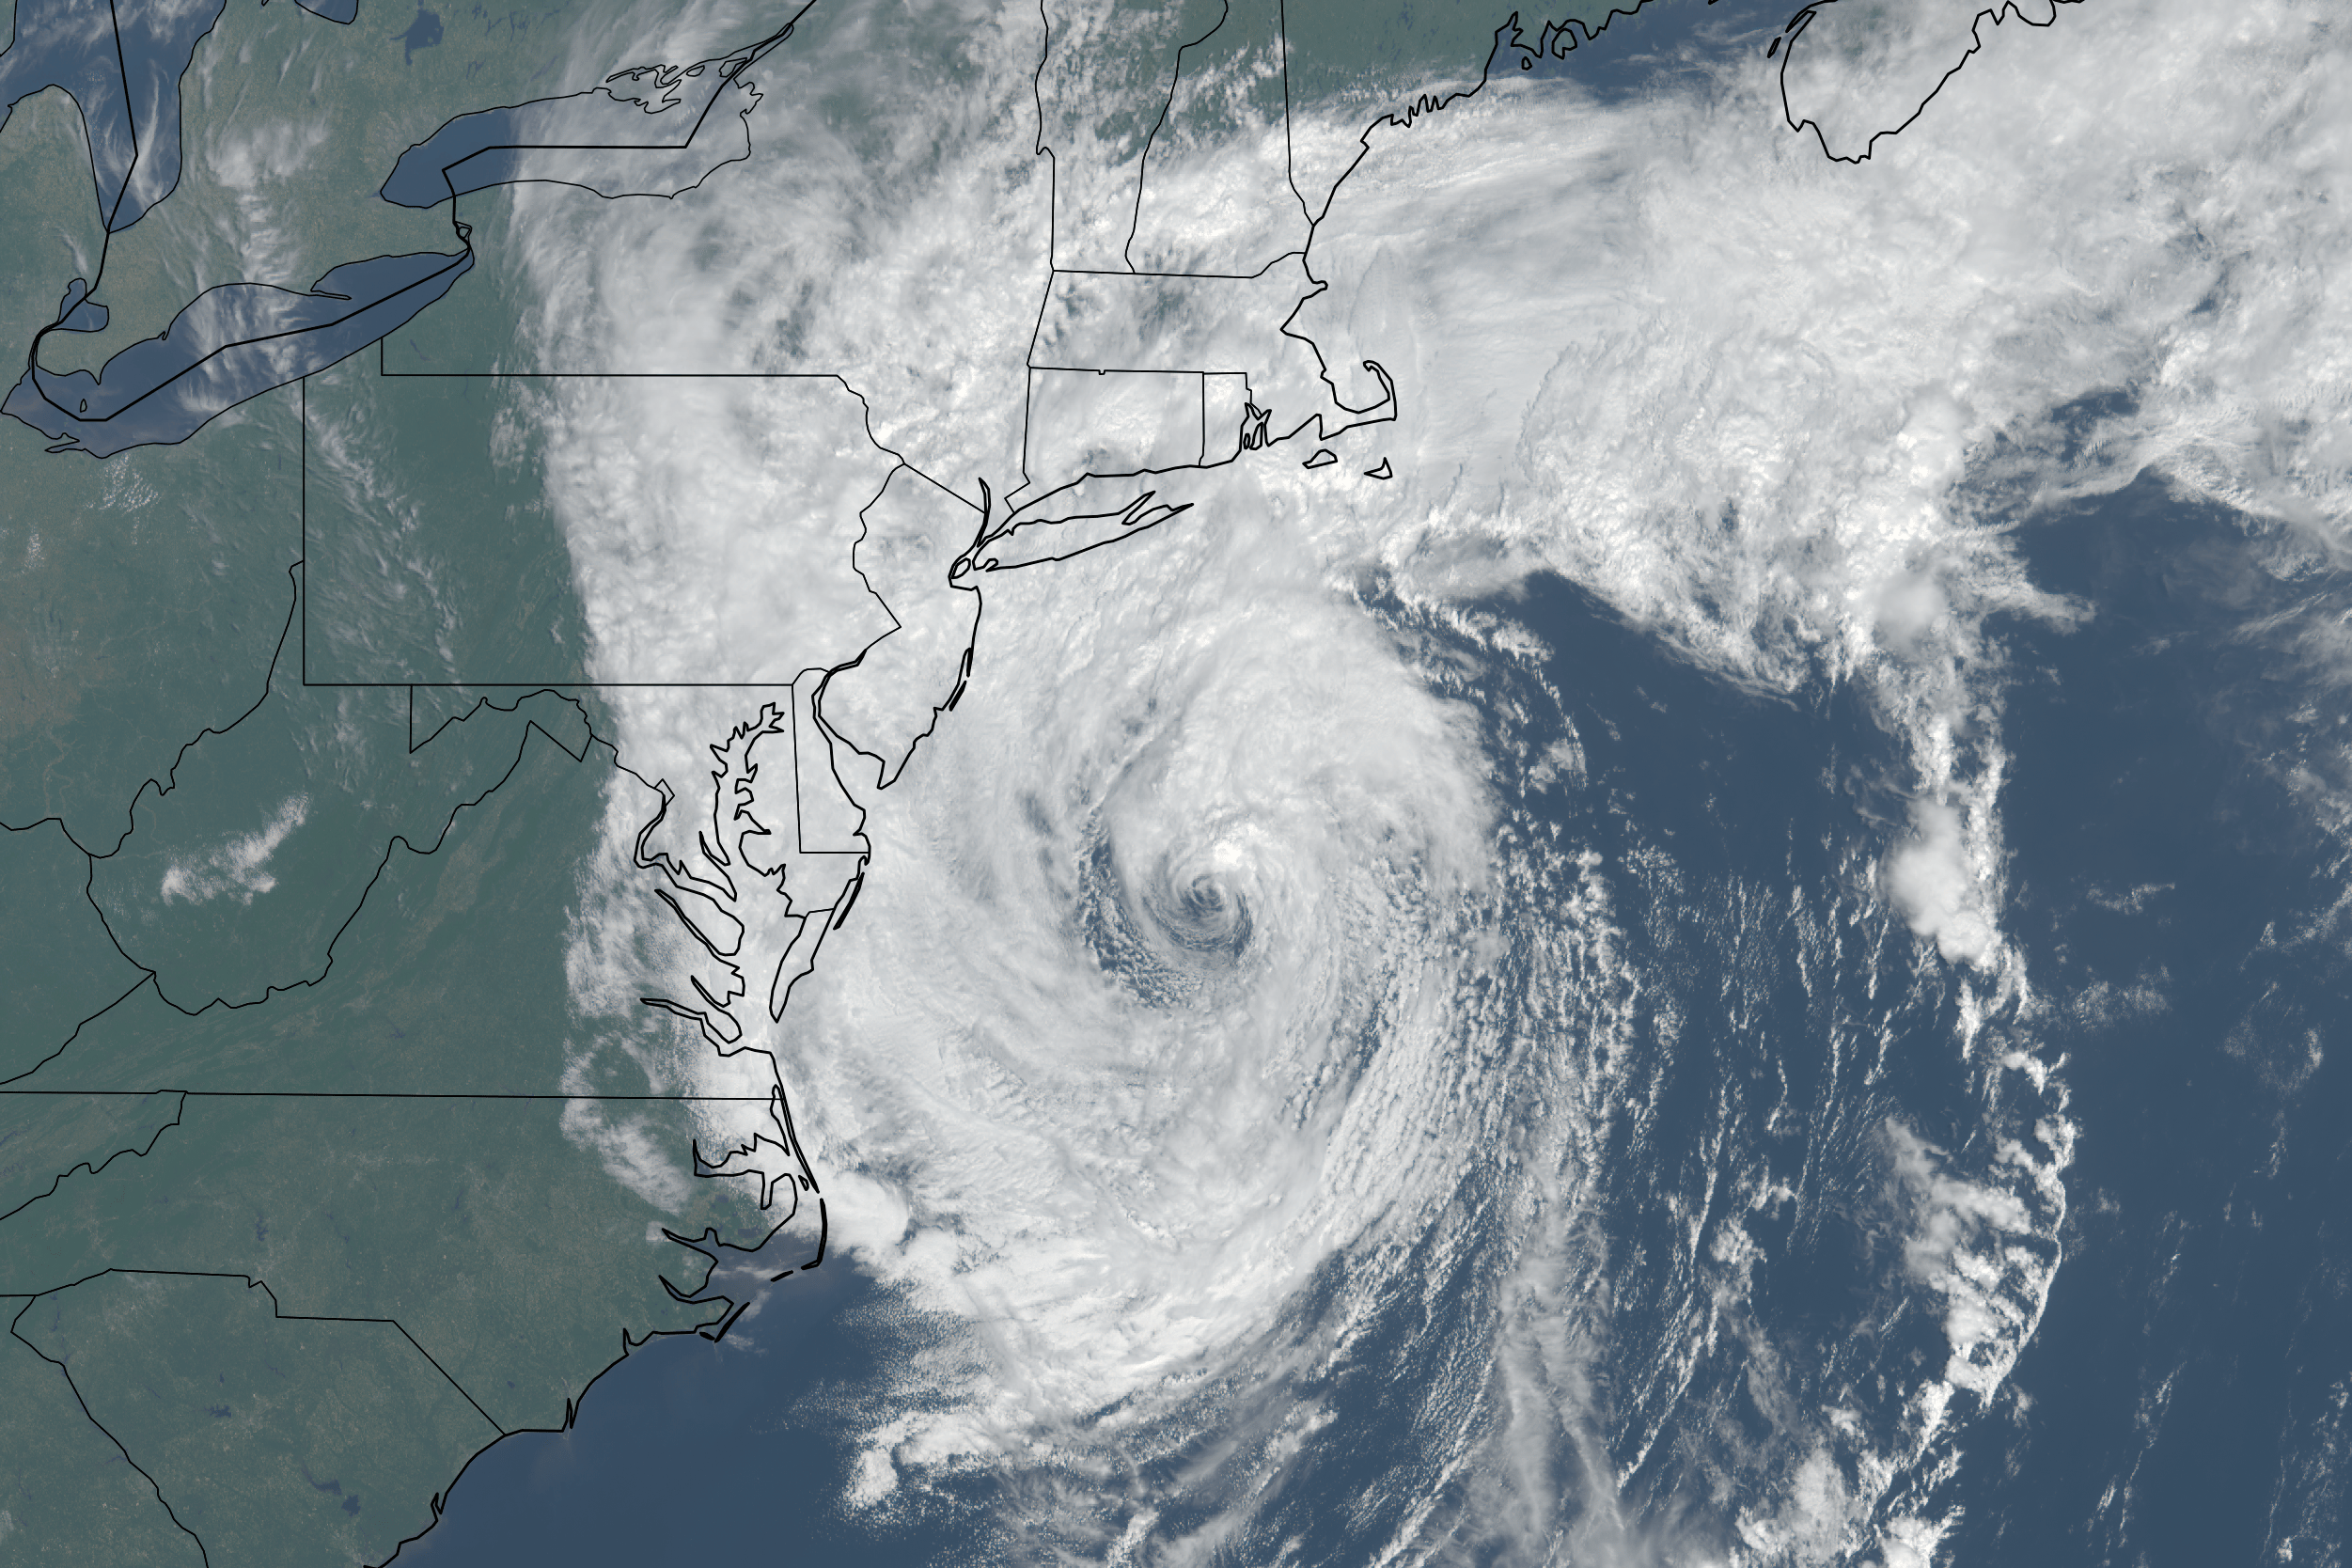
A little over a week ago, a slow-moving nor'easter affected the Northeast US and Mid Atlantic with prolonged heavy rain, wind and coastal flooding. Its intensity wasn't very unusual for a nor'easter - the Weather Prediction Center (WPC) surface analysis shows a peak minimum pressure of 986 hPa, while for comparison the February 2026 blizzard peaked at 965 hPa - but it was noteworthy for being unusually early for a nor'easter, and unusually long-lasting.
The loop on the left shows its evolution as it slowly intensified and drifted north on September 25-26, before taking a sharp left turn into New Jersey on September 27 and finally weakening and starting to move out on the 28th. Parts of the Jersey shore and southeast Massachusetts ended up with over 8 inches of rain, while wind gusts peaked over 65-75 mph along these coastal areas - even as high as 81 mph in Montauk Point, Long Island.
Read on below for more thorough analyses of the nor'easter:
- A meteorological overview of the nor'easter, including why it happened so early in the season
- Why the nor'easter wasn't classified as a tropical or subtropical cyclone
- What were some of the forecast communication challenges for the nor'easter
Section 1: Meteorological Overview #
Why was there a nor'easter in September in the first place? #
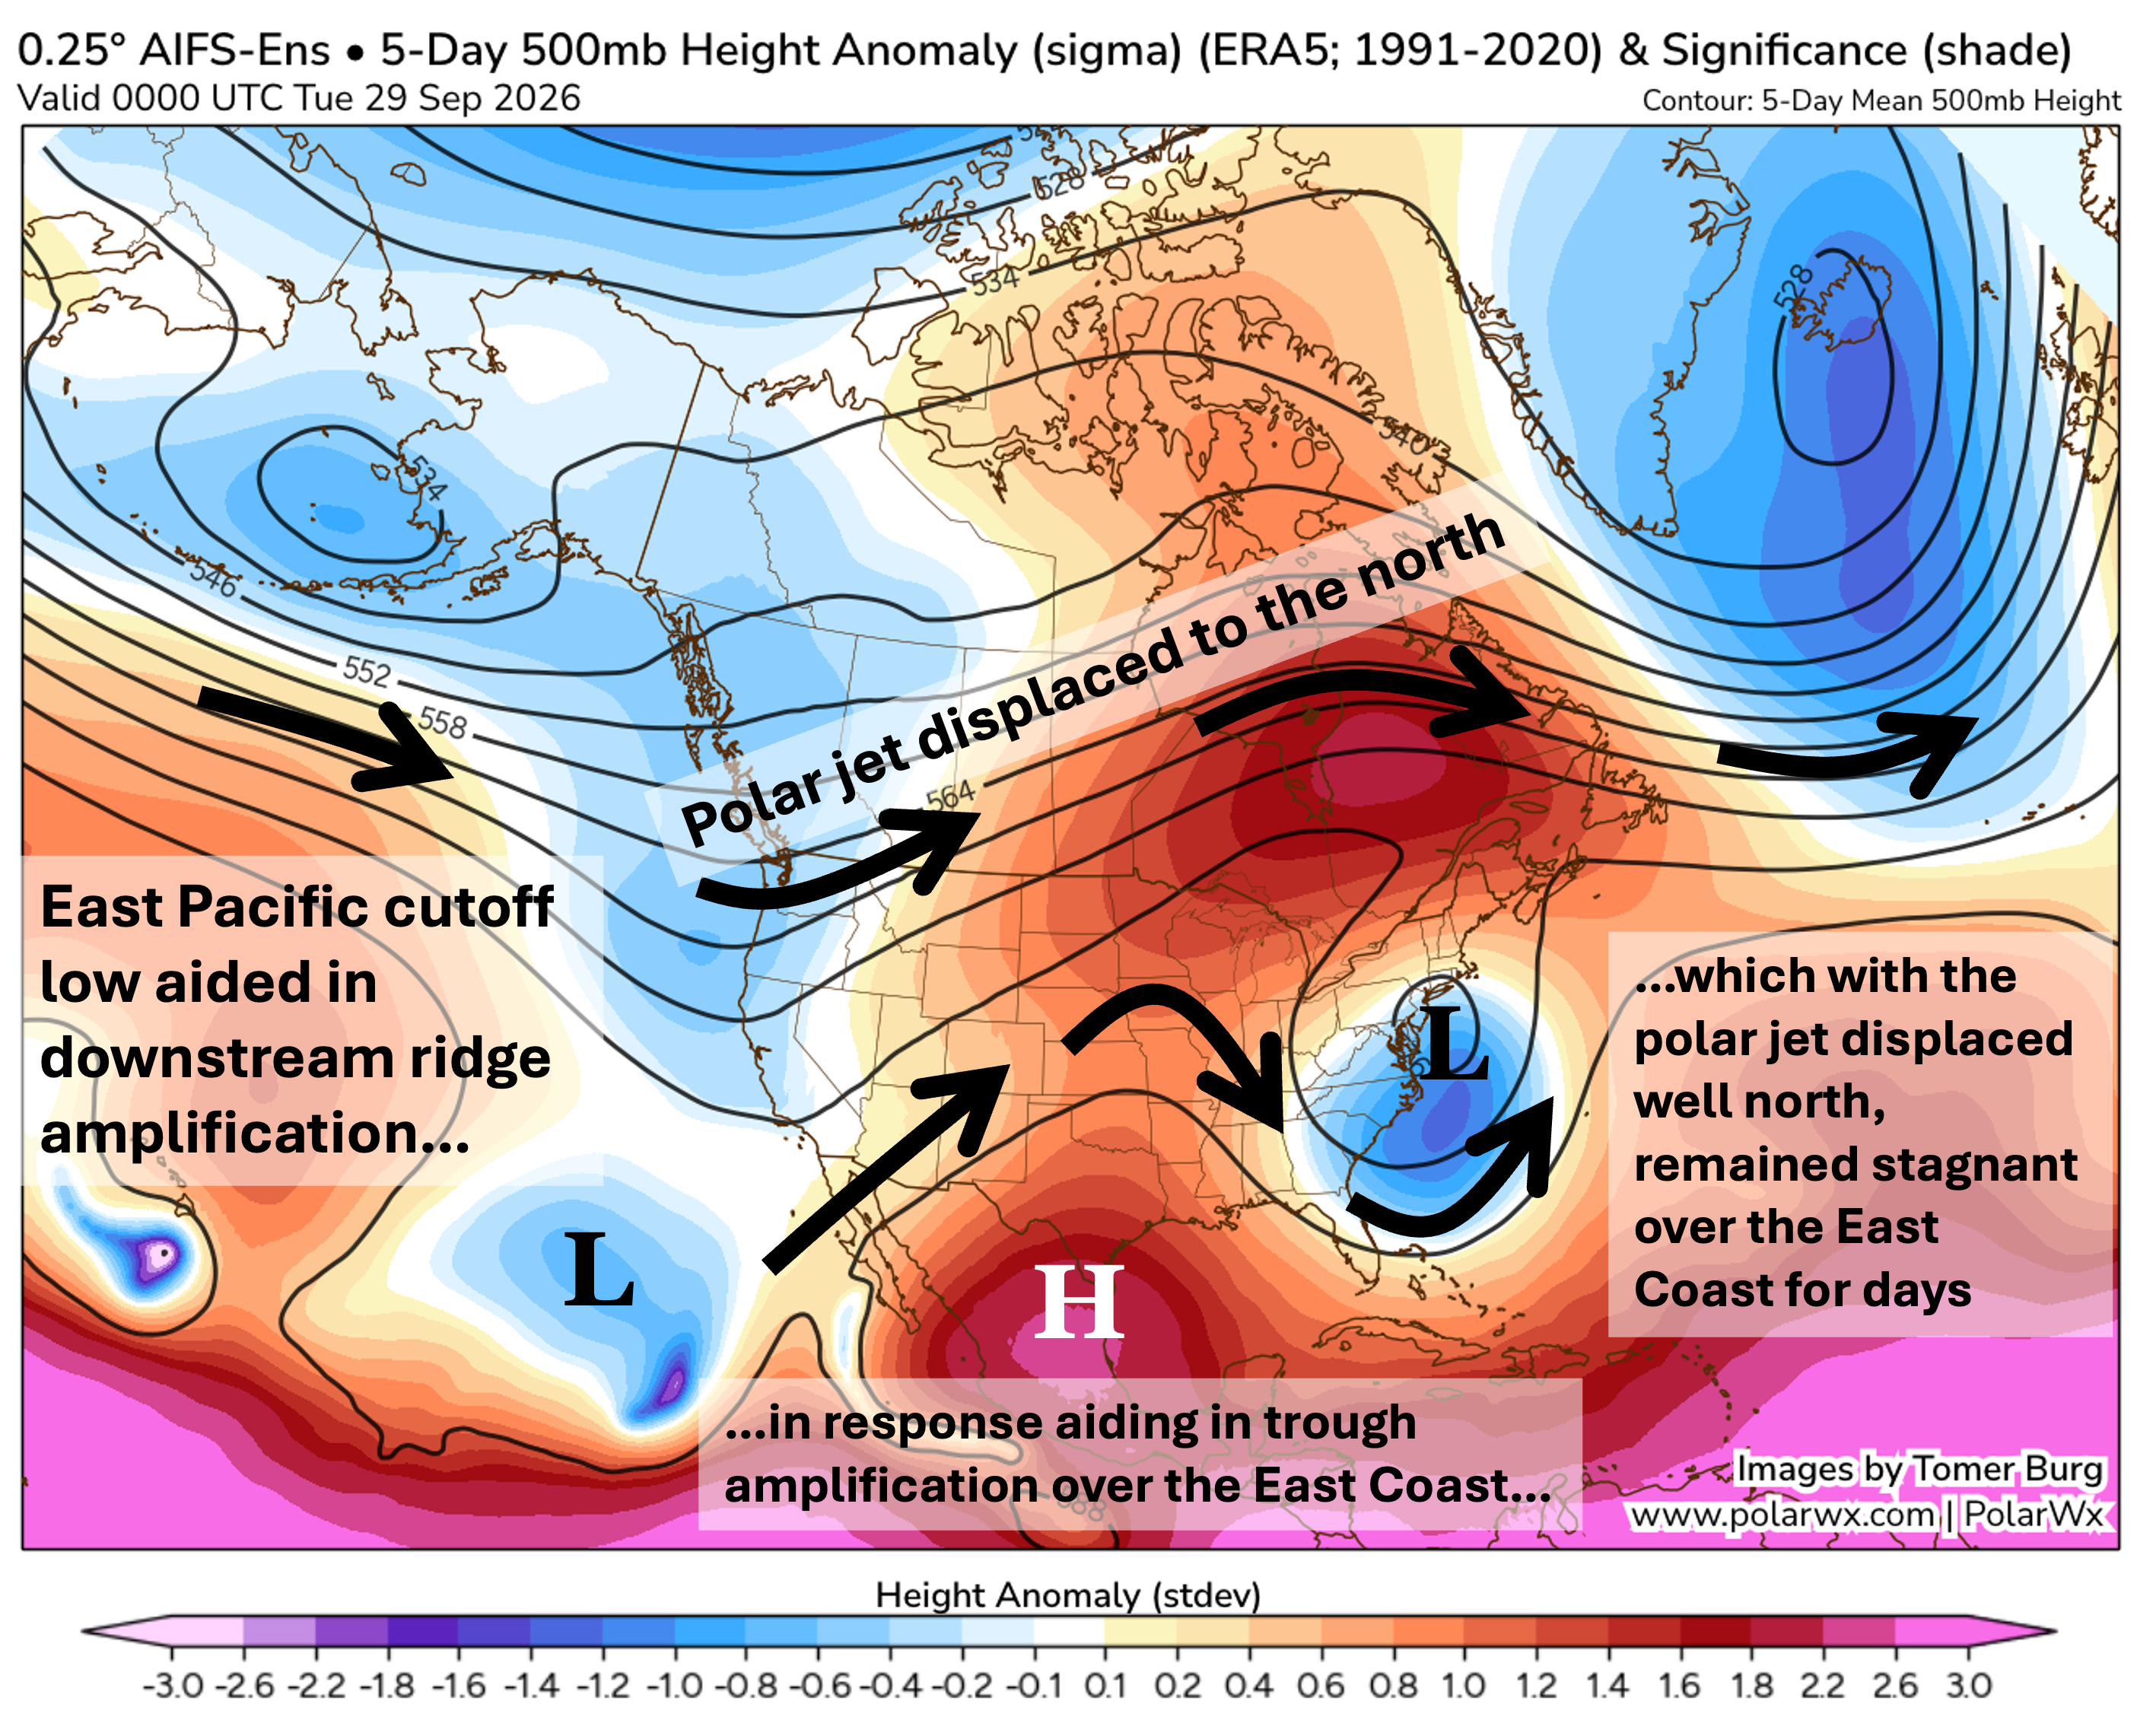
Nor'easters are unusual this early in the year. The typical midlatitude jet stream and cyclone track in September is often well north of the Mid Atlantic and Northeast US coastal corridor, and storm tracks that do track through the area this time of year are often - but not always - tropical cyclones or their remnants.
So what was different about this one? The polar jet stream was displaced well to the north, cutting across central Canada, favoring a persistent area of mid-upper level ridging over southeast Canada. At the same time, the subtropical jet extended into the central U.S. where a high-amplitude ridge was situated.
The high-level summary is that this kind of pattern favors cyclogenesis off the East Coast, and with no north stream disturbance to erode the ridging to the north, the cutoff low meandered off the coast for several days, contributing to the exceptionally long duration of the cyclone.
Synoptic overview of the nor'easter #
This is a technical section - if you're less interested in the detailed meteorological analysis, skip to the next section.
Additionally, this blog now has a new feature - clicking on links with an image icon next to them opens images visualizing what that text explains. Try it out below!
The precursor to cyclogenesis was a trough that bypassed New England on September 22-23, bringing with it a cooler airmass and a surface high pressure in its wake, associated with geostrophic convergence and forcing for subsidence tied to anticyclonic vorticity advection. The associated low-level cold air advection advected the existing baroclinic zone (i.e., temperature gradient) south over the next day until the low-level flow became oriented near parallel to the temperature gradient, at which point the baroclinic zone became near stationary off the coast of the Carolinas on September 24.
By this point, a shortwave trough entering from the Ohio Valley (seen here in the thickness contours, more pronounced in the 500-hPa vorticity loop below) becomes a key player in driving the nor'easter's initial development. From a potential vorticity (PV) framework, as the upper-tropospheric +PV anomaly approaches the coast, its associated circulation extends to the baroclinic zone inducing southerly flow, resulting in low-level warm air advection. This creates a warm surface potential temperature and +PV anomaly, resulting in the initial development of the surface cyclone.
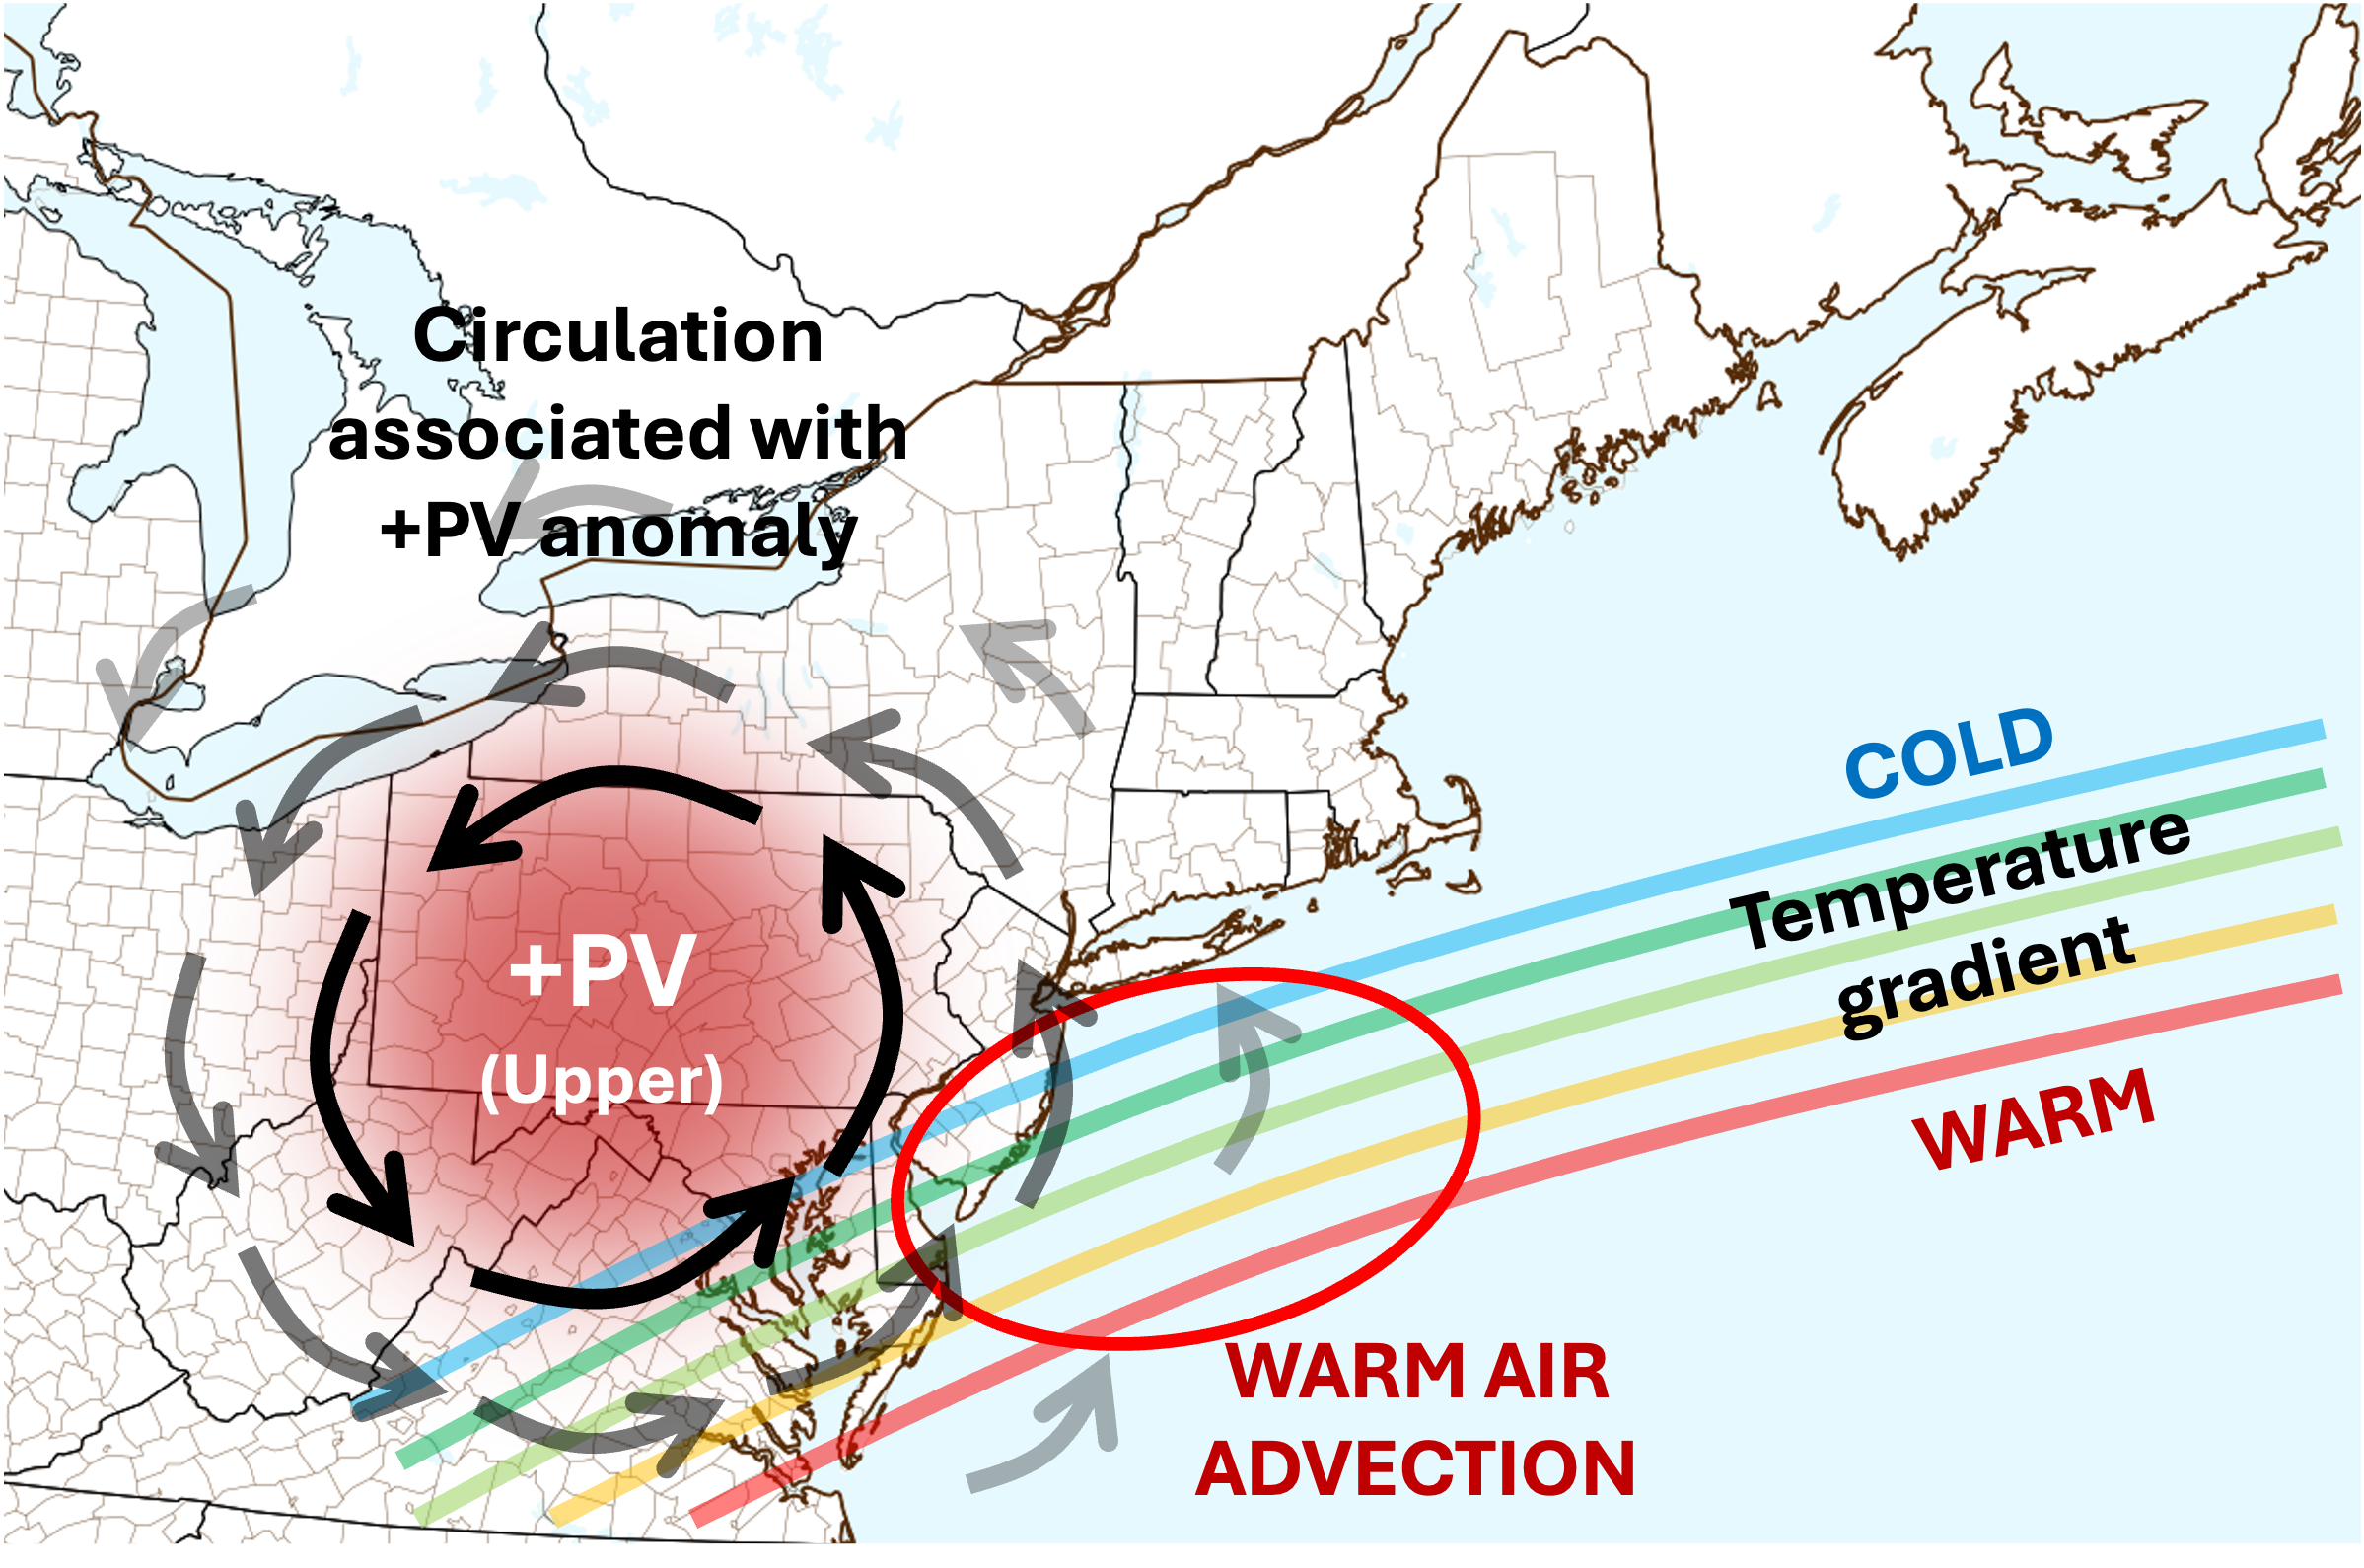
Shifting gears to 500-hPa (mid-tropospheric) vorticity, we can see the aforementioned shortwave digging into the southeast US in response to the upstream Plains ridge, aiding in the development of the surface cyclone late on September 24. As the surface cyclone and associated +PV anomaly continues to strengthen, both surface and upper-level PV anomalies continue to interact with each other, on the east side acting in tandem to strengthen the warm front, and upstream of the surface cyclone resulting in cold air advection. Accordingly the surface cyclone's baroclinicity and amplitude increase, which increases its feedback on the upper-level PV anomaly via its circulation.
This mutual +PV interaction and positive feedback process continues until both PV anomalies become vertically aligned, at which point neither can amplify the other, which in this case occurs early on September 26. By this time, the bent-back warm front has nearly wrapped around the center of the cyclone, as can be seen above in the 2-meter theta-e animation, which leads to a pocket of isolated relatively warm and moist air almost completely surrounded by cooler air. This is referred to as warm seclusion, and is the mature cyclone phase of the Shapiro-Keyser cyclone model.
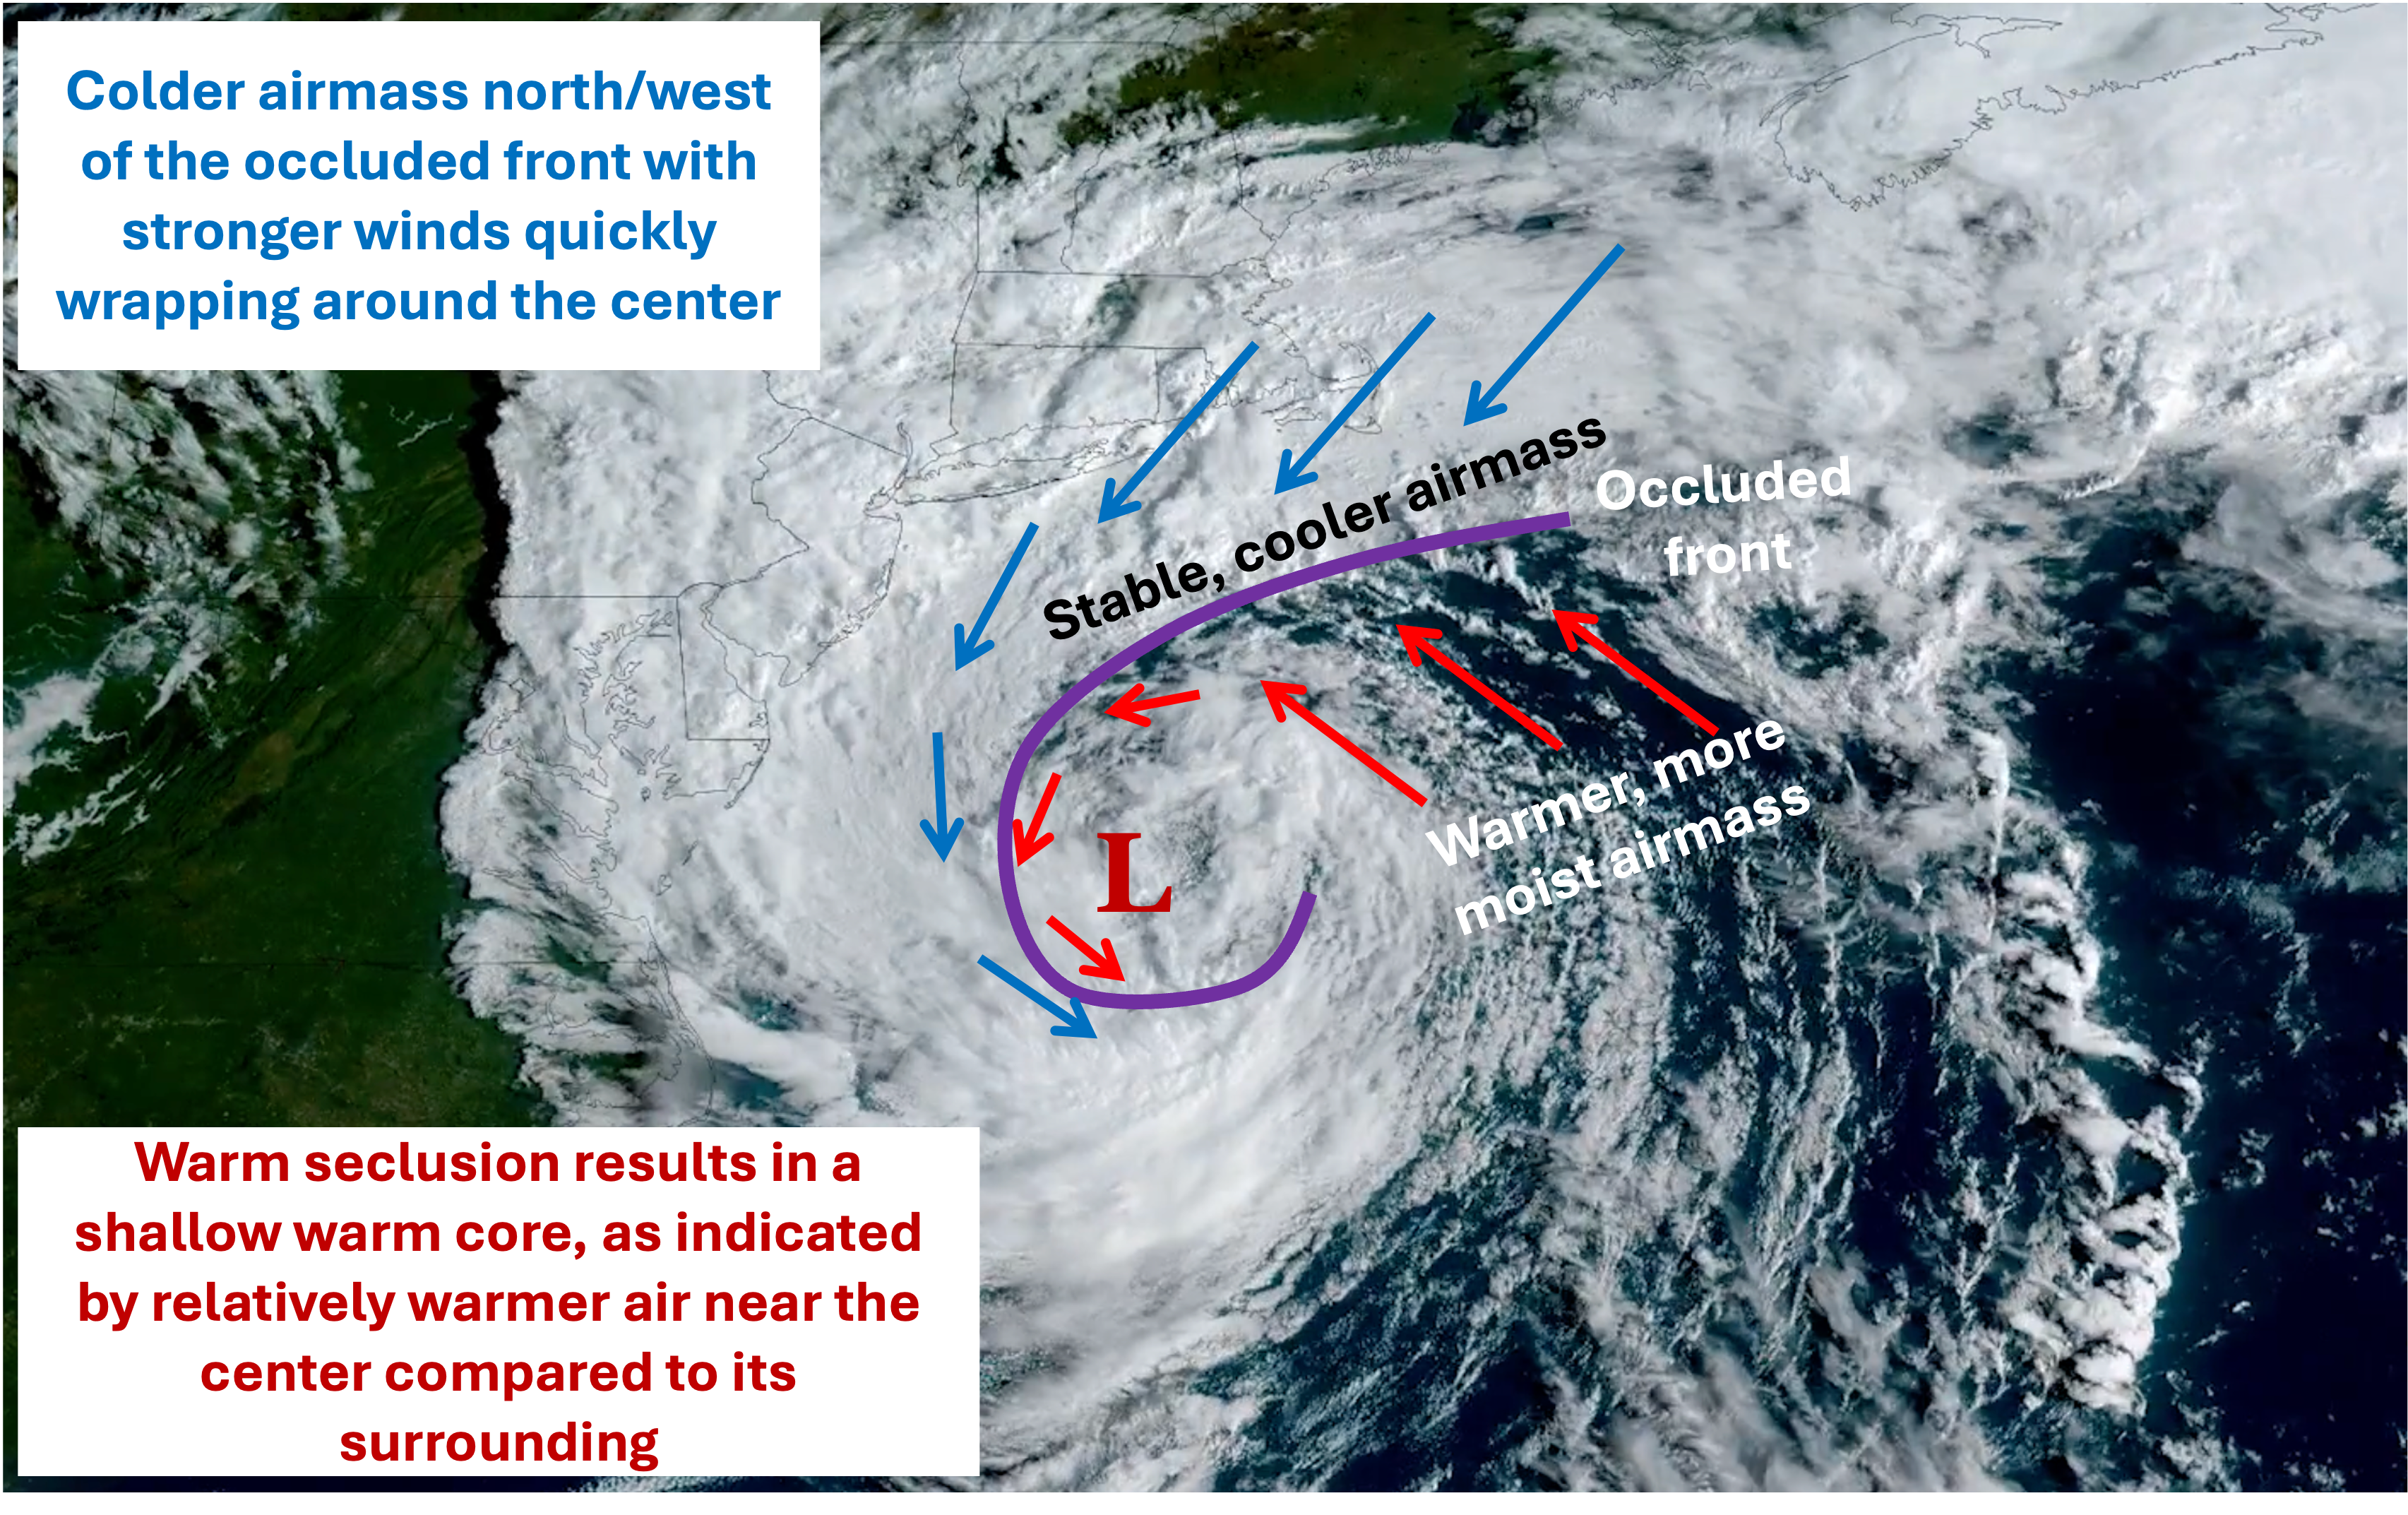
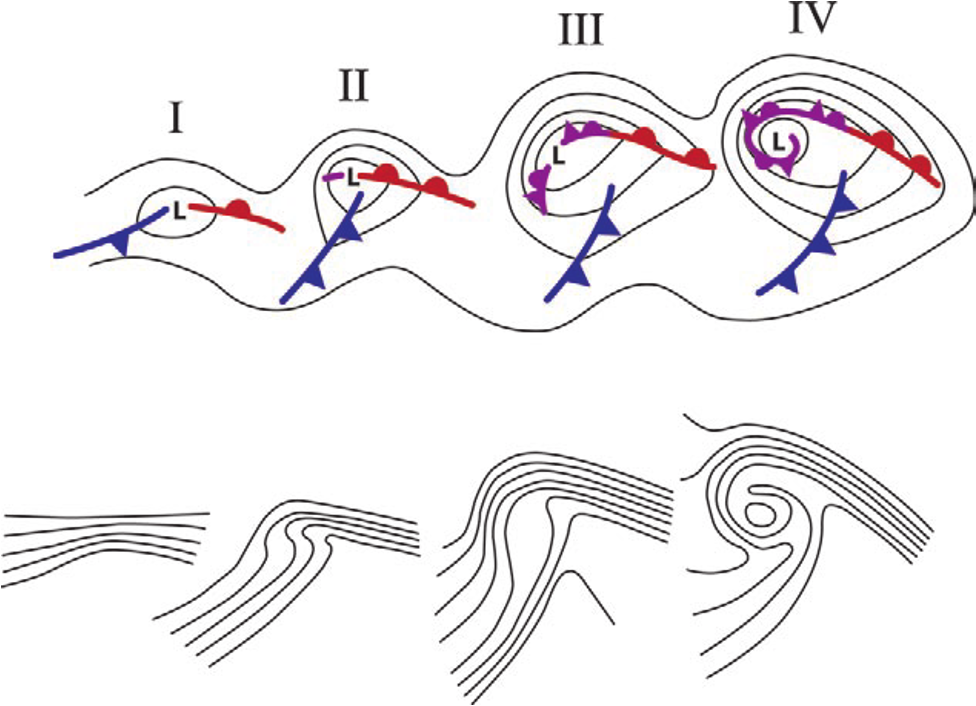
This isolated pocket of relatively warm and moist air near the center of the cyclone relative to its surrounding is indicative of some sort of a warm core - this will be relevant for the next section discussing why this alone is not enough to classify a storm as a tropical or subtropical cyclone.
Once the cyclone reaches its peak in intensity, it initially drifts north slowly throughout the day on September 26, before sharply veering to the left overnight into September 27 as it makes landfall in New Jersey. This evolution can't be explained as cleanly using 500-hPa vorticity, so we'll shift gears higher up in the atmosphere to look at the dynamic tropopause, commonly defined as a constant surface of 2 PVU.
On September 26, we see a tropopause vortex, characterized on this loop by a local minimum in potential temperature along the tropopause (light blue shading), digging into Ohio downstream of the still-stagnant Plains ridge. Late on September 26 into the overnight hours, this tropopause vortex loops to the south of the surface cyclone, at which point yet another baroclinic interaction occurs between the two features, with the tropopause vortex's induced circulation advecting the surface cyclone to the west and the surface cyclone's circulation advecting the tropopause vortex to its south, then east. This process continues until they become vertically aligned in the early hours of September 27, during which the baroclinic zone and vorticity advection have shifted downstream, and the surface cyclone loses its baroclinic support and weakens more substantially.
Section 2: Why it wasn't classified as a tropical or subtropical cyclone #
The title of this section might seem rather subjective - and this wouldn't be the first time there was debate over whether a tropical or subtropical cyclone should or should not have been classified. Logically, this is indicative of edge cases - there is a broad spectrum of cyclone structures, which in operations gets condensed into just 3 categories: tropical, subtropical, extratropical. Given some ambiguity in where exactly the delineation between these 3 categories falls, and especially an ambiguity in exactly when and how to classify subtropical cyclones, different meteorologists might classify cases that arguably overlap between categories differently. With that said, this section will make the argument for why even with categorical ambiguity, it was meteorologically correct to not classify this cyclone as tropical or subtropical.
First, we need to define what the criteria is for a tropical and subtropical cyclone. Using the NHC glossary definitions (emphases are my own):
Tropical cyclone: A warm-core non-frontal synoptic-scale cyclone, originating over tropical or subtropical waters, with organized deep convection and a closed surface wind circulation about a well-defined center. Once formed, a tropical cyclone is maintained by the extraction of heat energy from the ocean at high temperature and heat export at the low temperatures of the upper troposphere. In this they differ from extratropical cyclones, which derive their energy from horizontal temperature contrasts in the atmosphere (baroclinic effects).
Subtropical cyclone: A non-frontal low-pressure system that has characteristics of both tropical and extratropical cyclones. Like tropical cyclones, they are non-frontal, synoptic-scale cyclones that originate over tropical or subtropical waters, and have a closed surface wind circulation about a well-defined center. In addition, they have organized moderate to deep convection, but lack a central dense overcast. Unlike tropical cyclones, subtropical cyclones derive a significant proportion of their energy from baroclinic sources, and are generally cold-core in the upper troposphere, often being associated with an upper-level low or trough. In comparison to tropical cyclones, these systems generally have a radius of maximum winds occurring relatively far from the center (usually greater than 60 n mi), and generally have a less symmetric wind field and distribution of convection.
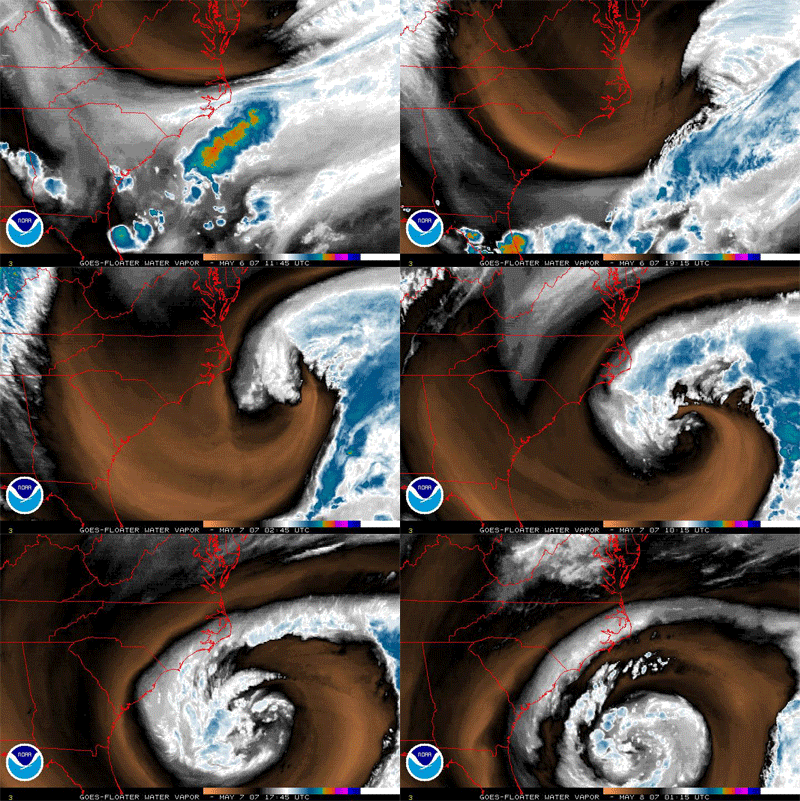
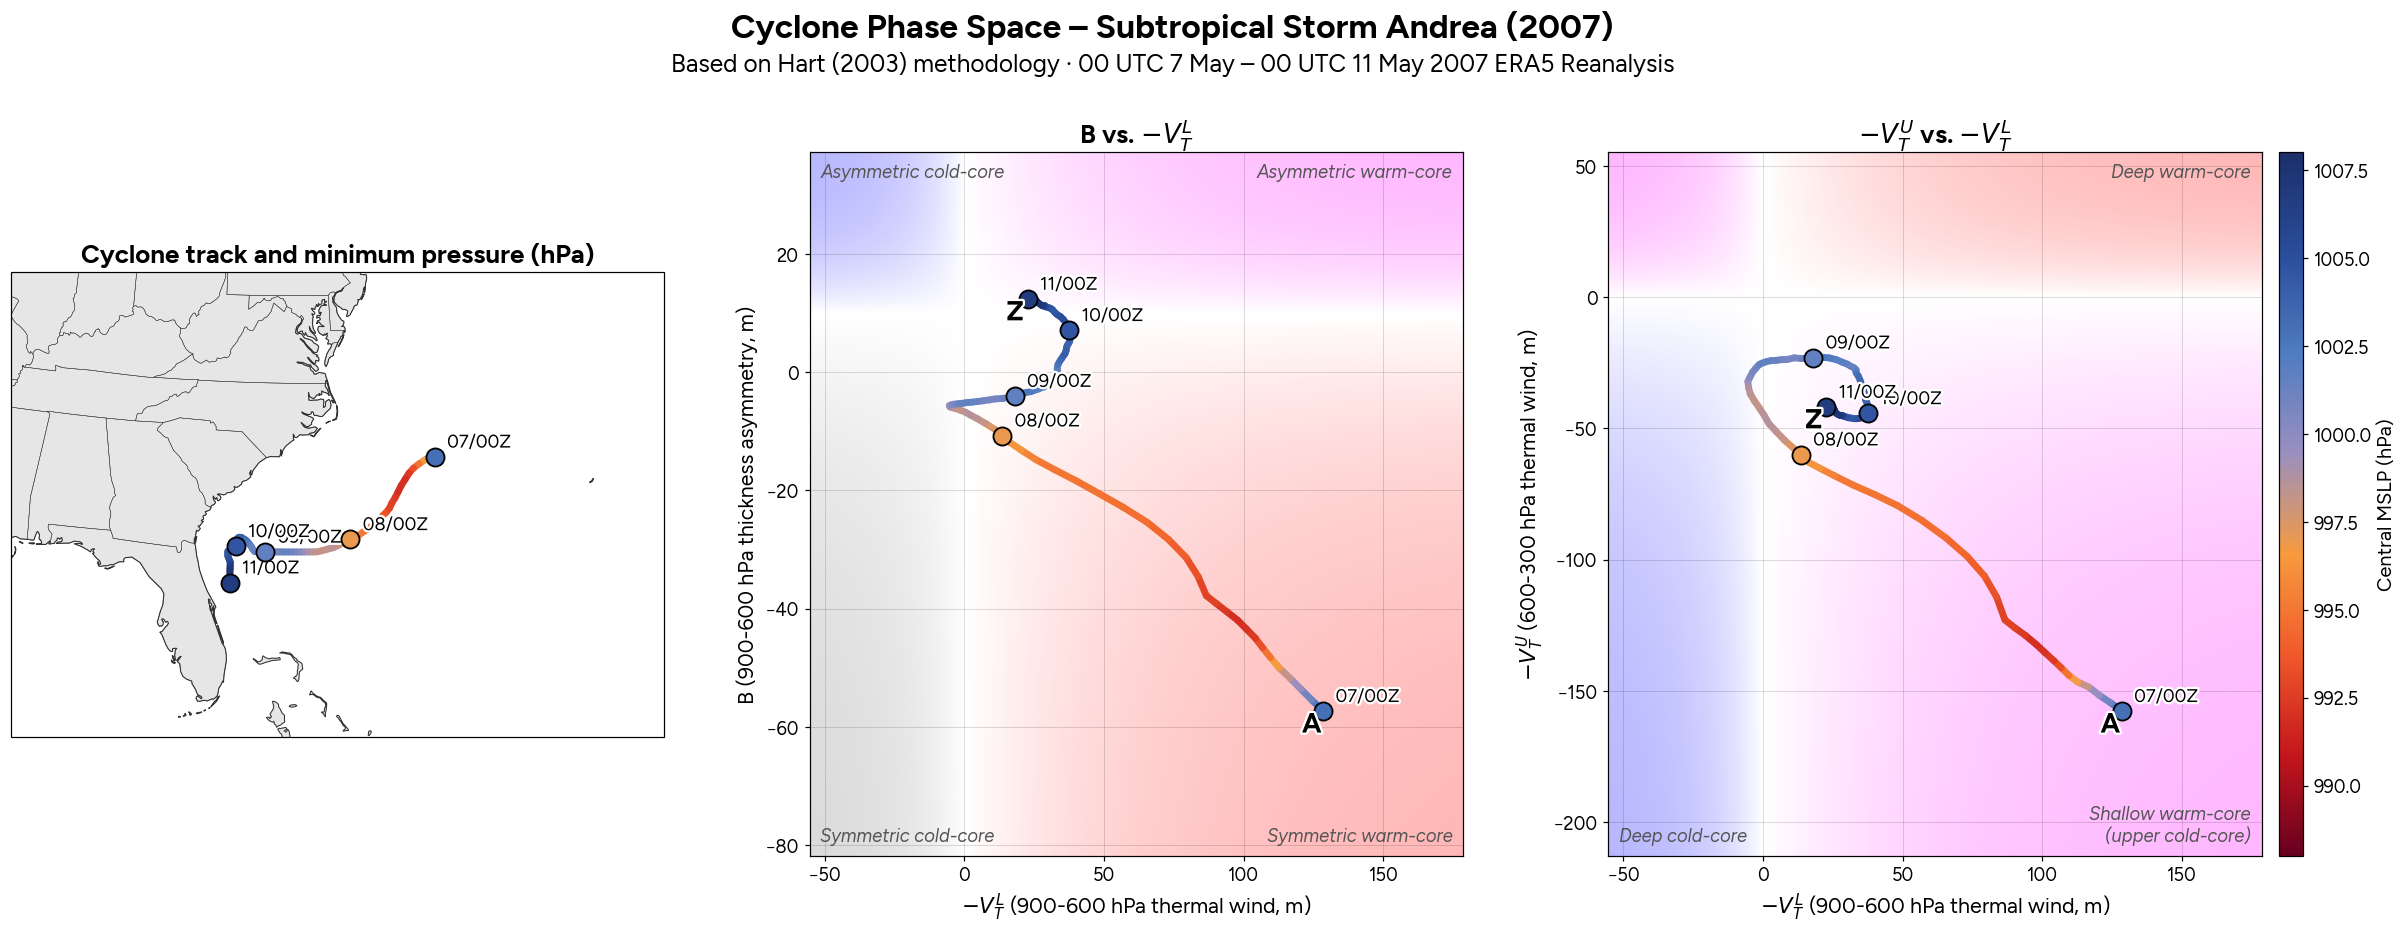
A well-known example of a subtropical cyclone is Subtropical Storm Andrea (2007), which had non-tropical origins as an extratropical cyclone off the Mid-Atlantic coast. After losing its baroclinic support and detaching from its fronts, it drifted southwest into warmer waters, at which point its circulation became more symmetric and moderate to intermittently deep convection developed and persisted. Unlike tropical cyclones, it lacked a central dense overcast, its maximum winds were fairly well removed from its center, and it was still associated with an upper-level trough.
Another example of a subtropical cyclone I will refer to again later in this post occurred in January 2023 - and had a pathway that initially was not too different from this cyclone, in that it developed as an East Coast baroclinic cyclone which later became warm secluded and maintained persistent convection.
With these definitions of a tropical and subtropical cyclone in mind, we'll look at various methods and tools used to identify whether a cyclone is or has the potential to become tropical or subtropical, and what they showed for this nor'easter. This section is split into the following segments:
- Tropical cyclone formation probability tools
- Cyclone phase space and frontal structure
- Satellite-based structural evolution analysis
- Environmental instability
Tropical cyclone formation probability tools #
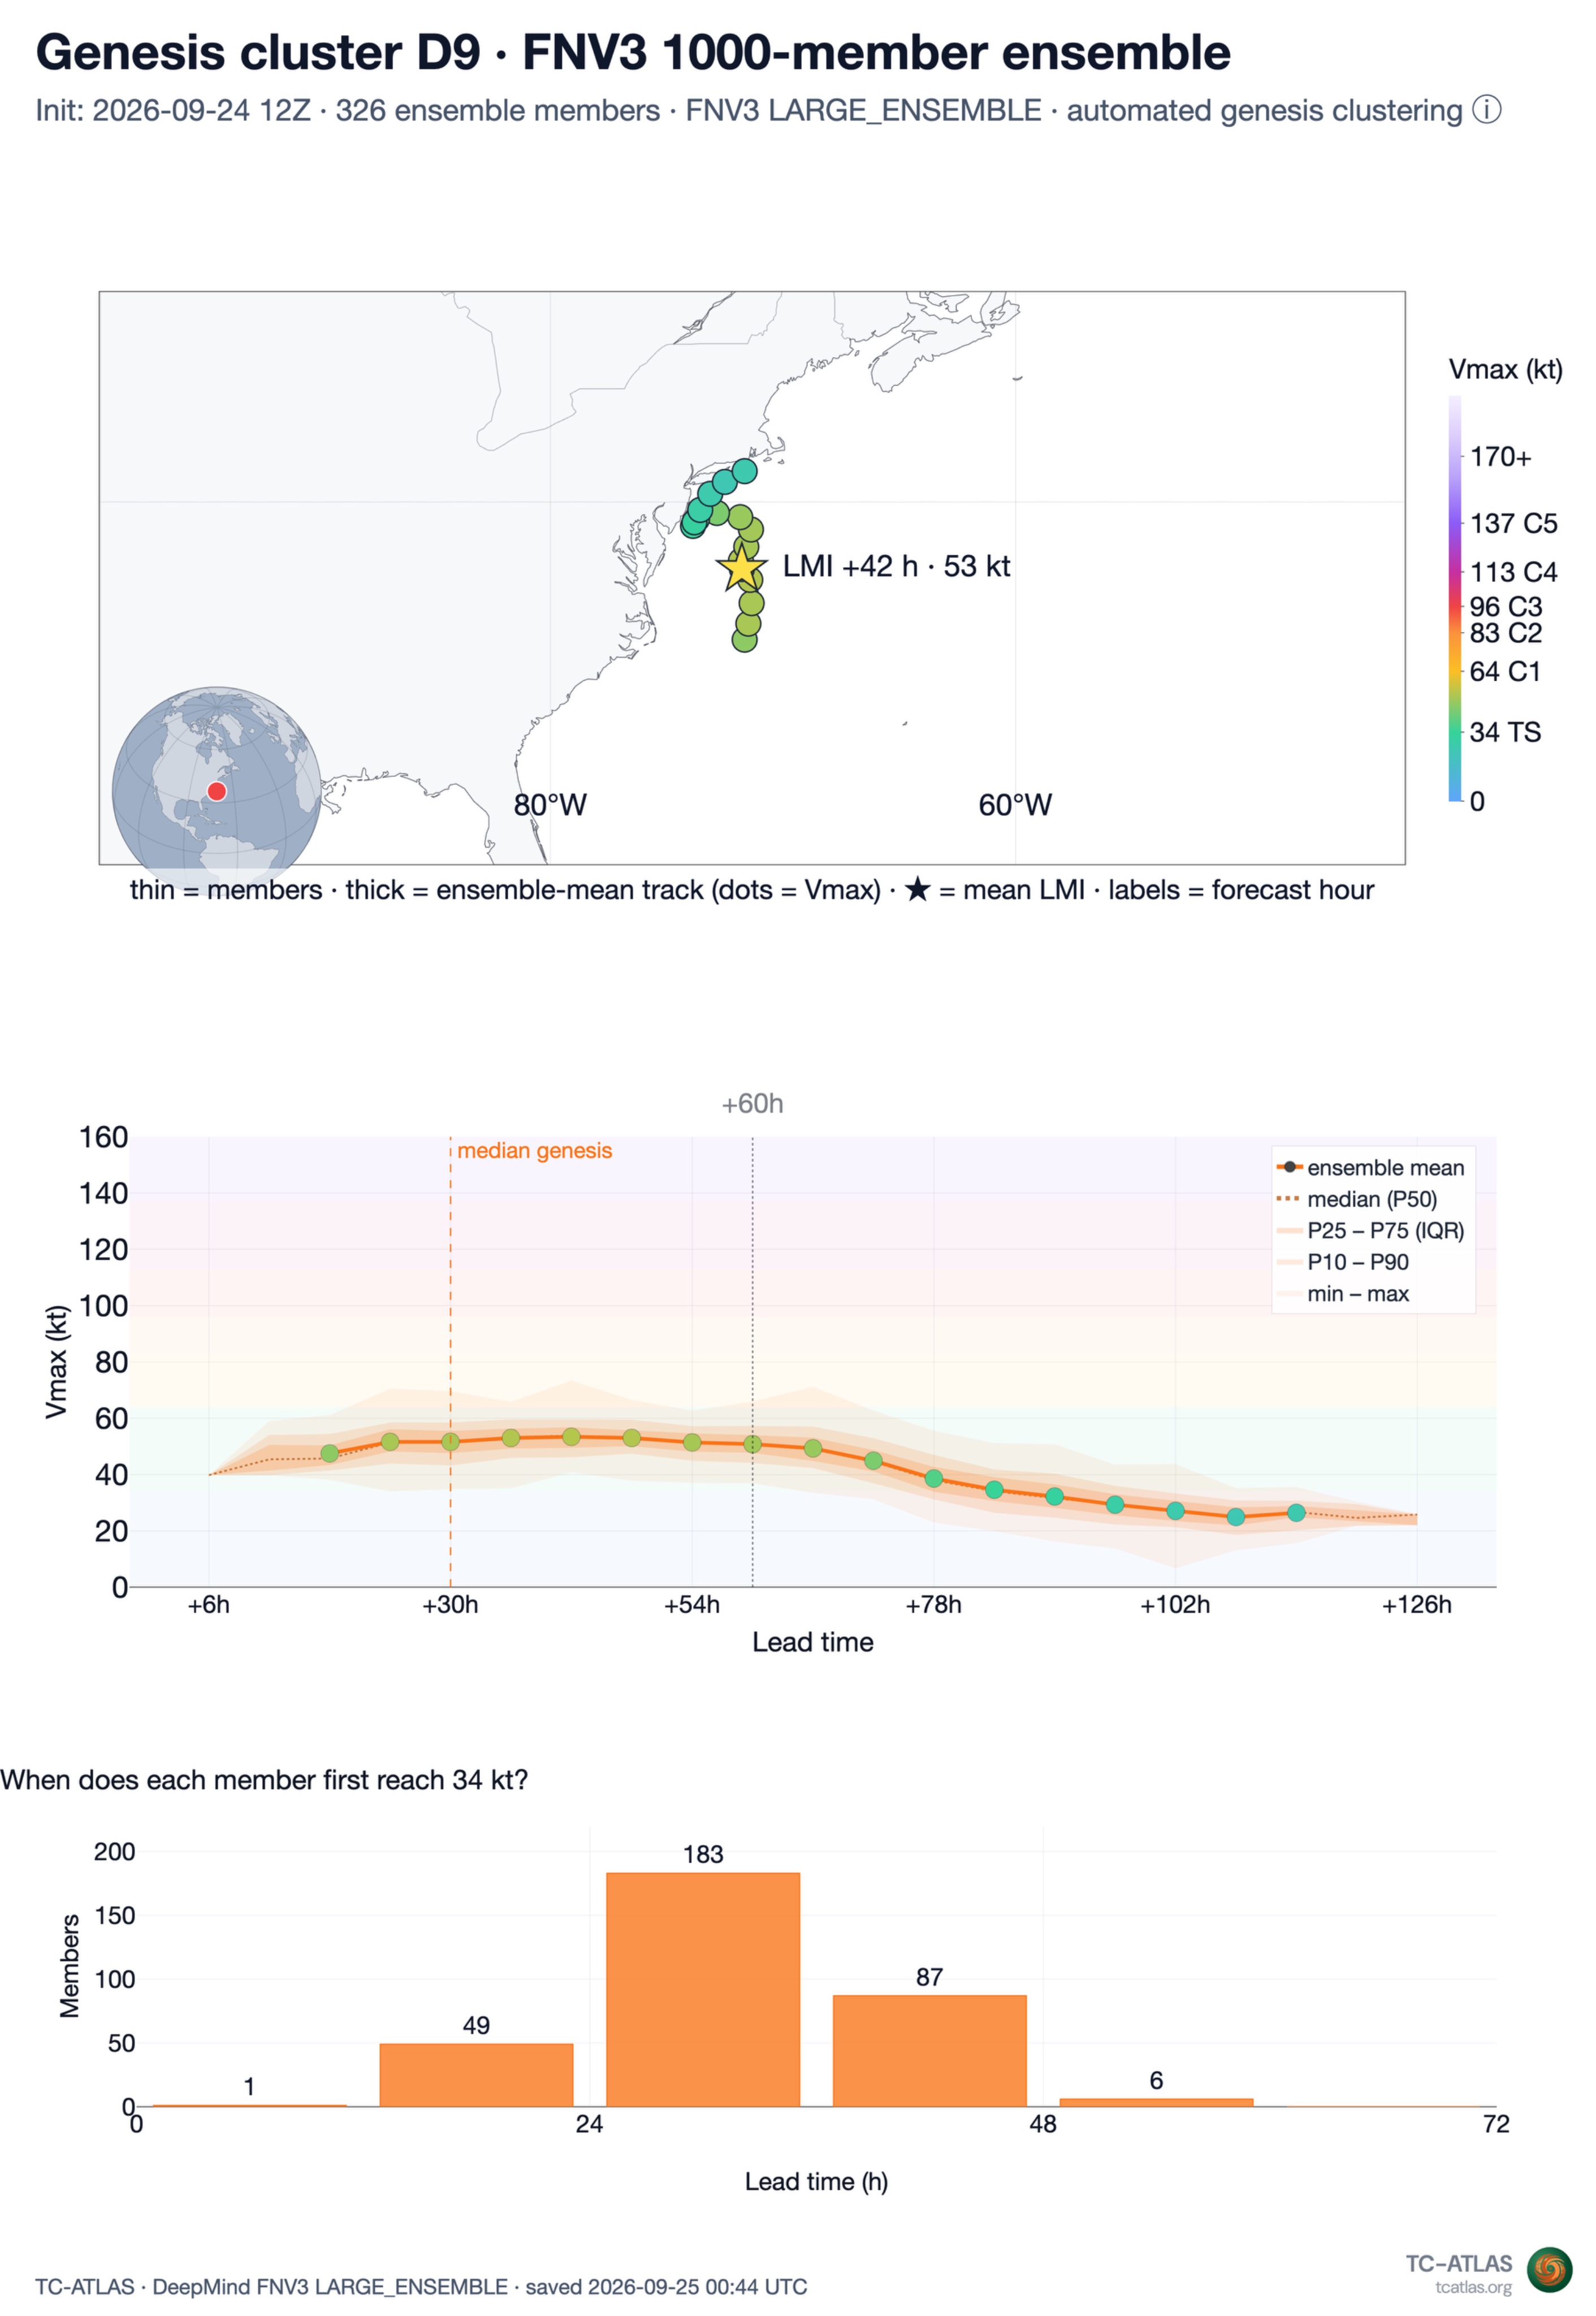
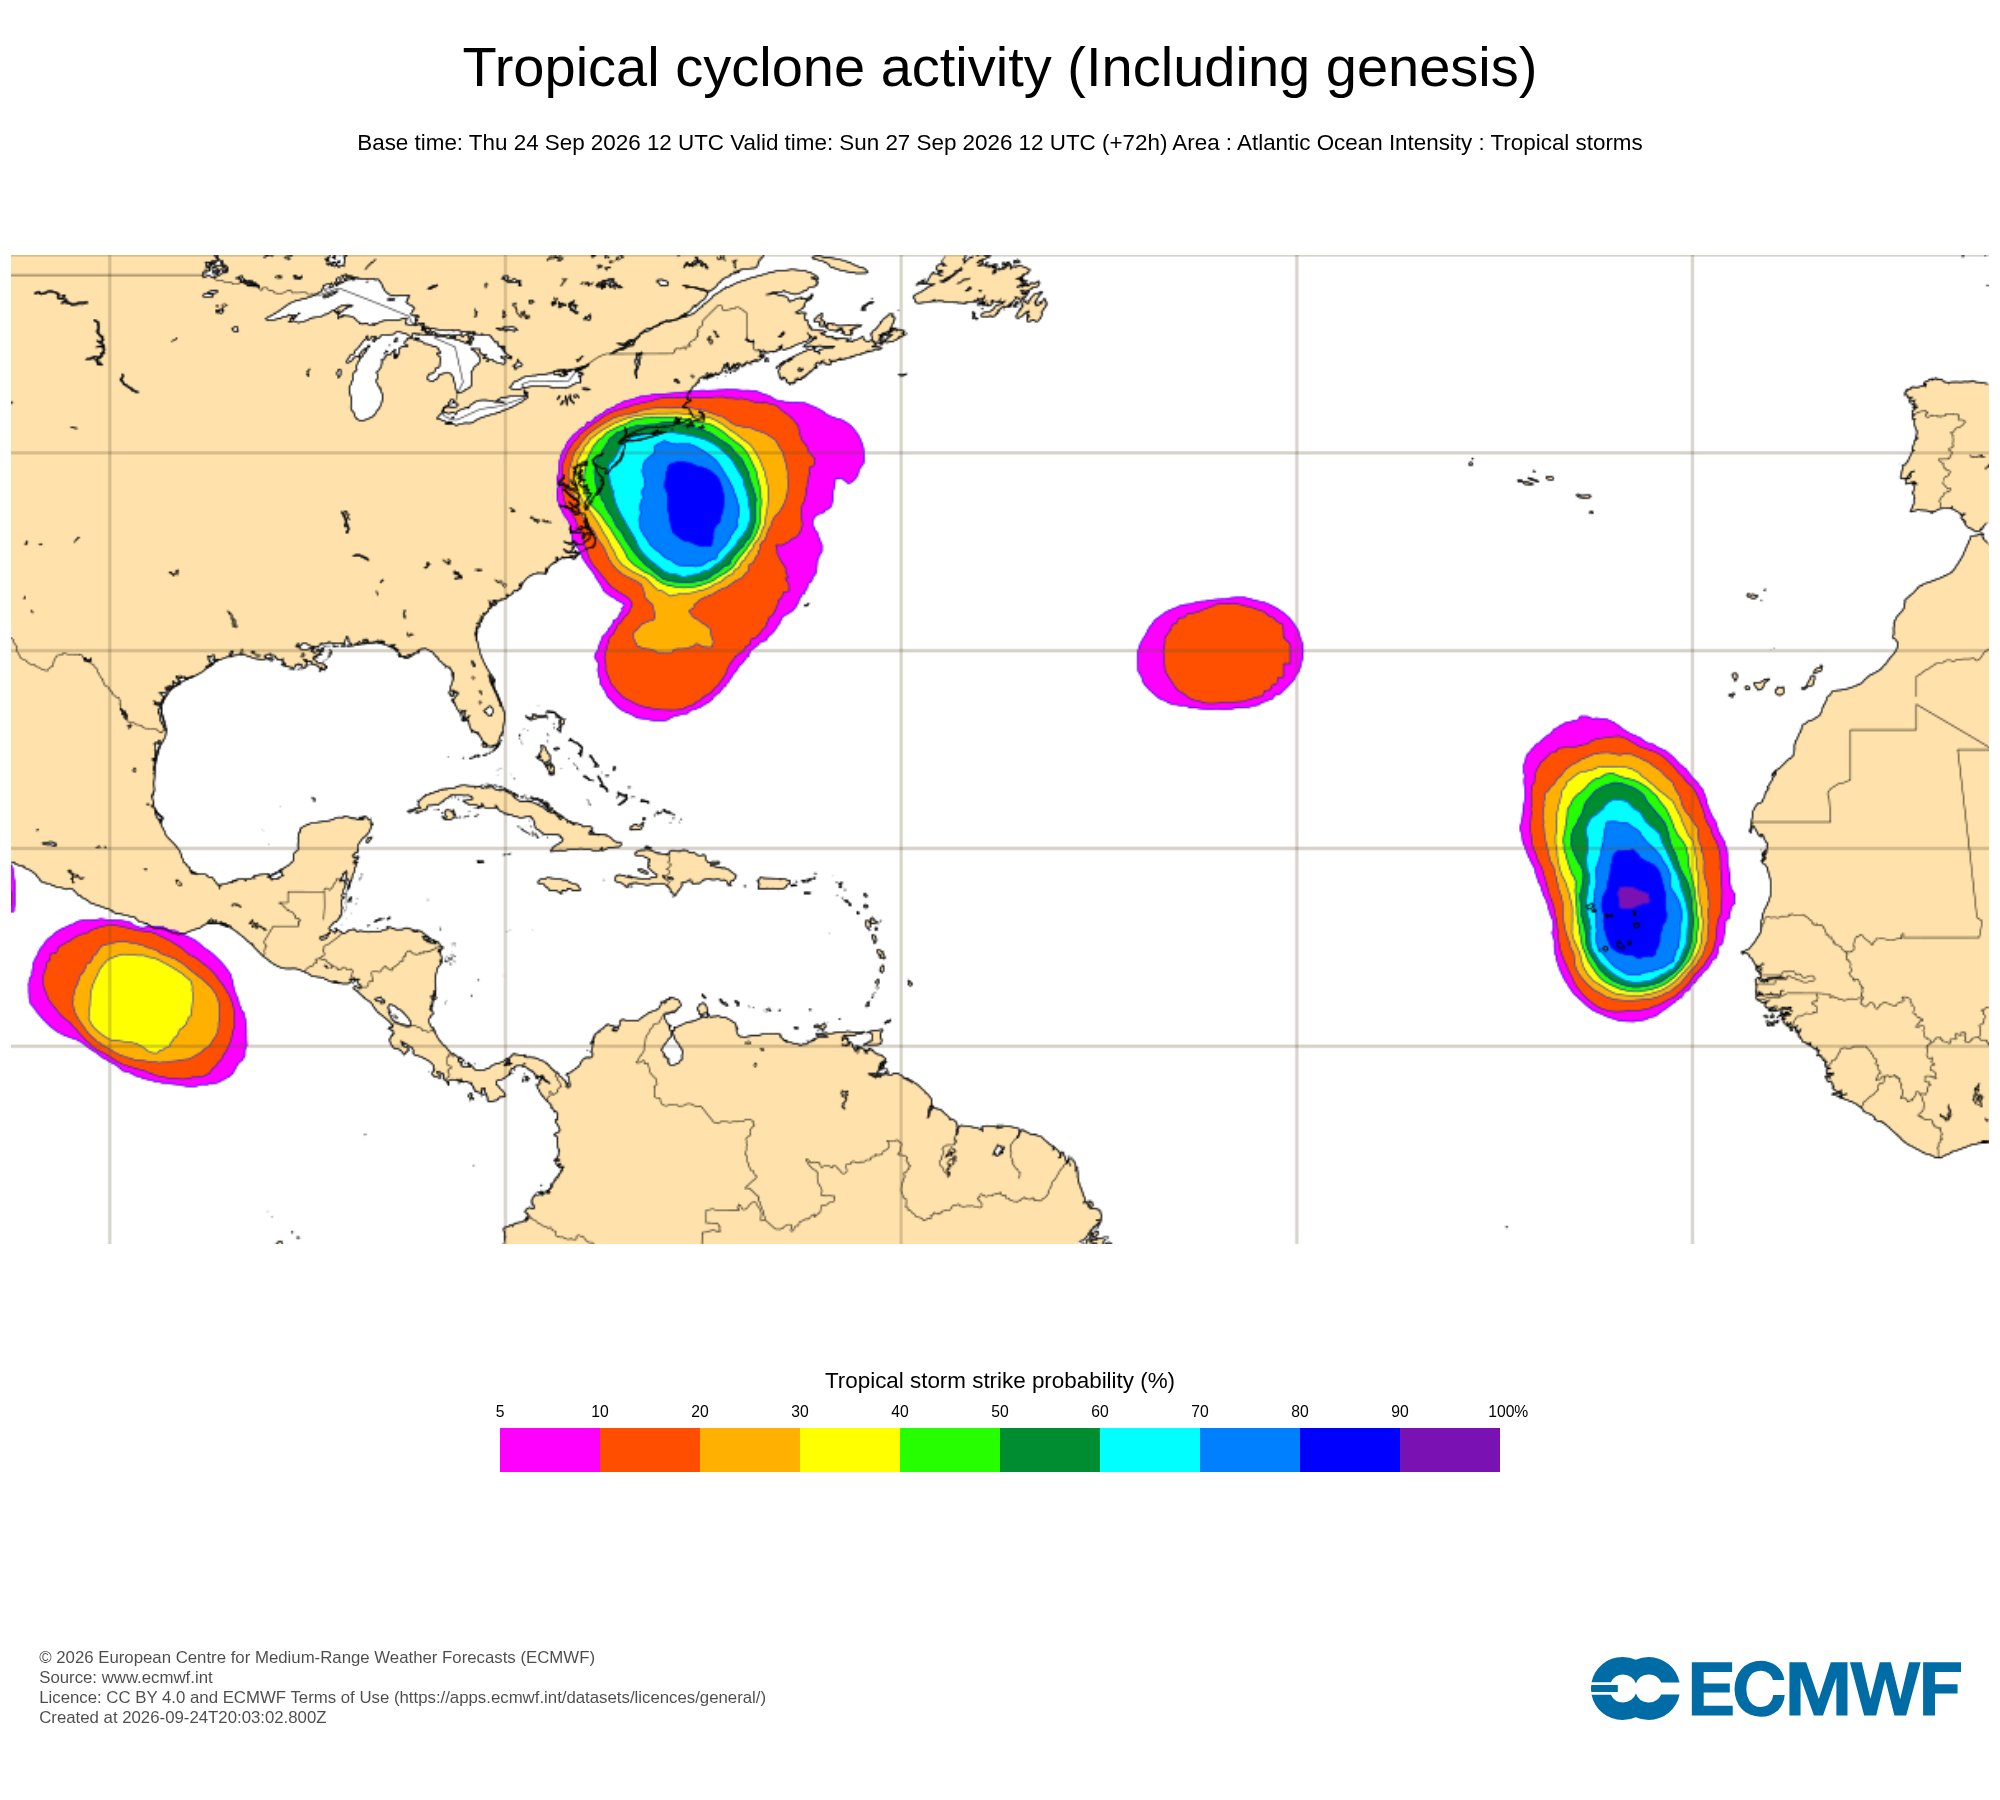
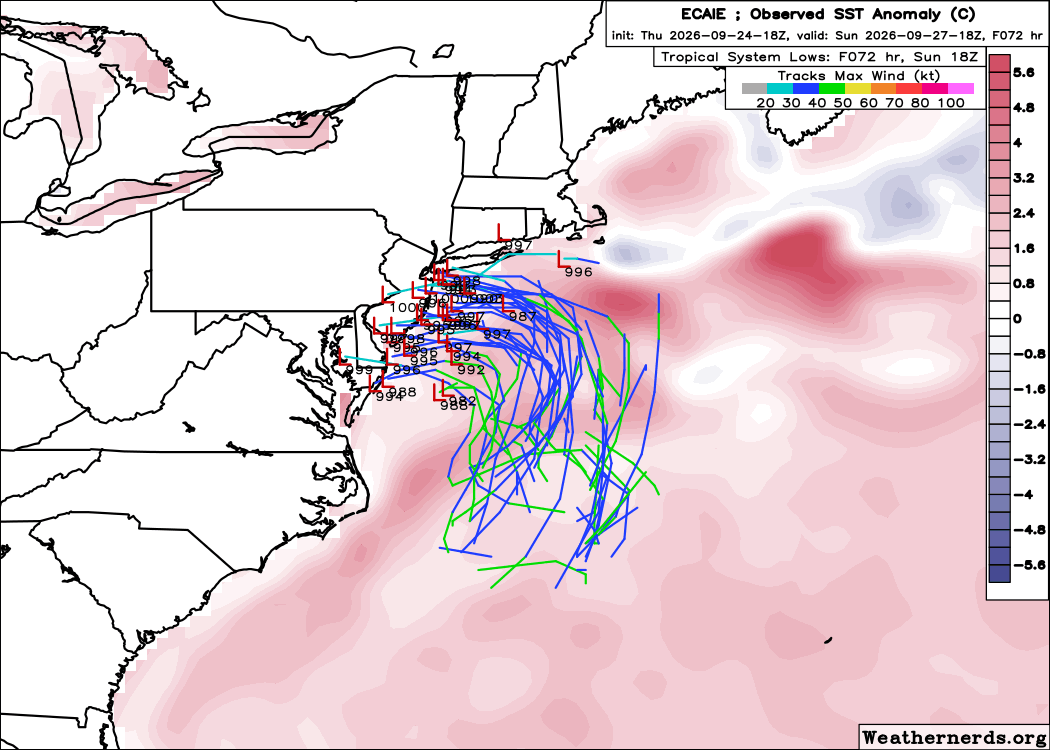
With how many ensembles are now available operationally, both traditional physics-based and newer machine learning ("AI") based, it would take far too long for any forecaster to parse through every ensemble member to assess every cyclone's structure. To help with this process, various algorithms exist that try to objectively determine the classification of a modeled storm.
One example shown above is Google DeepMind's 1000-member ensemble, which in this case their method identified a tropical or subtropical cyclone in 33% of members. Concurrently, ECMWF's physics-based EPS ensemble and machine learning based AIFS ensemble each showed over 80% probability of a tropical or subtropical cyclone.
Taking the above at face value, it might seem likely that the nor'easter would become tropical or subtropical. But this is only a starting point - we need to understand how these algorithms work to make the best use of them. From ECMWF's own description of their algorithm (emphasis below is my own):
Tropical storms are identified by the existence of a warm core isobaric depression. The charts show the probability of the passage of storms which have been identified in this way (some possibly not yet developed) within a 300 km radius of a given location. Very occasionally the technique mis-identifies high-latitude well-occluded frontal depressions as being a tropical cyclone.
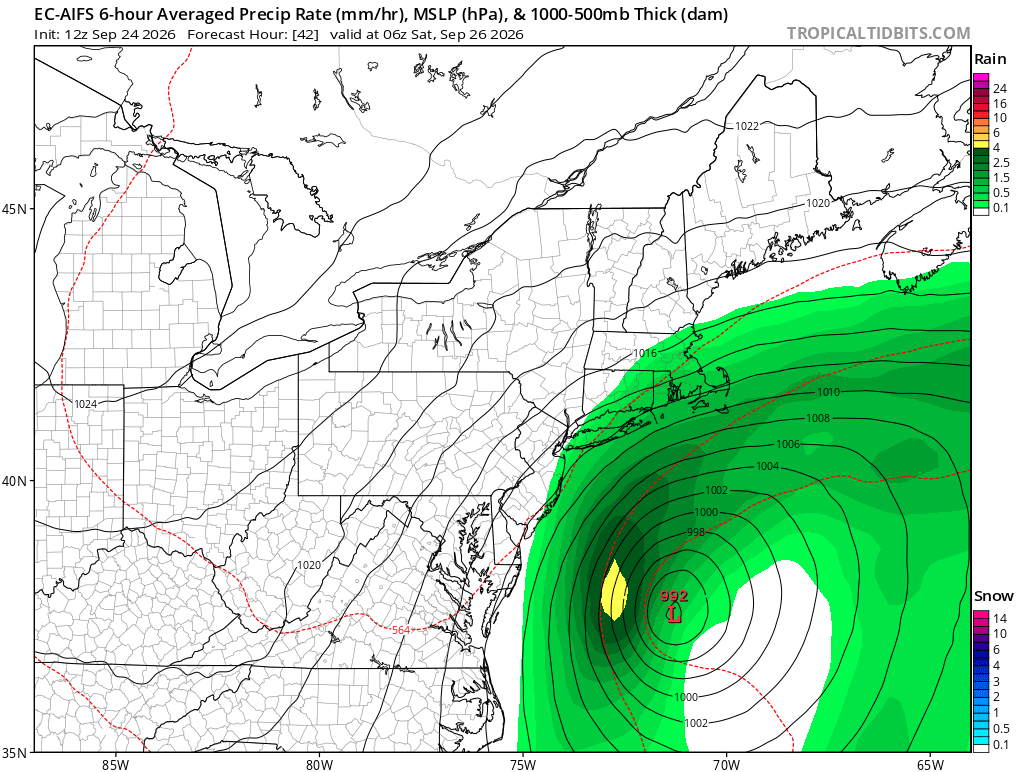
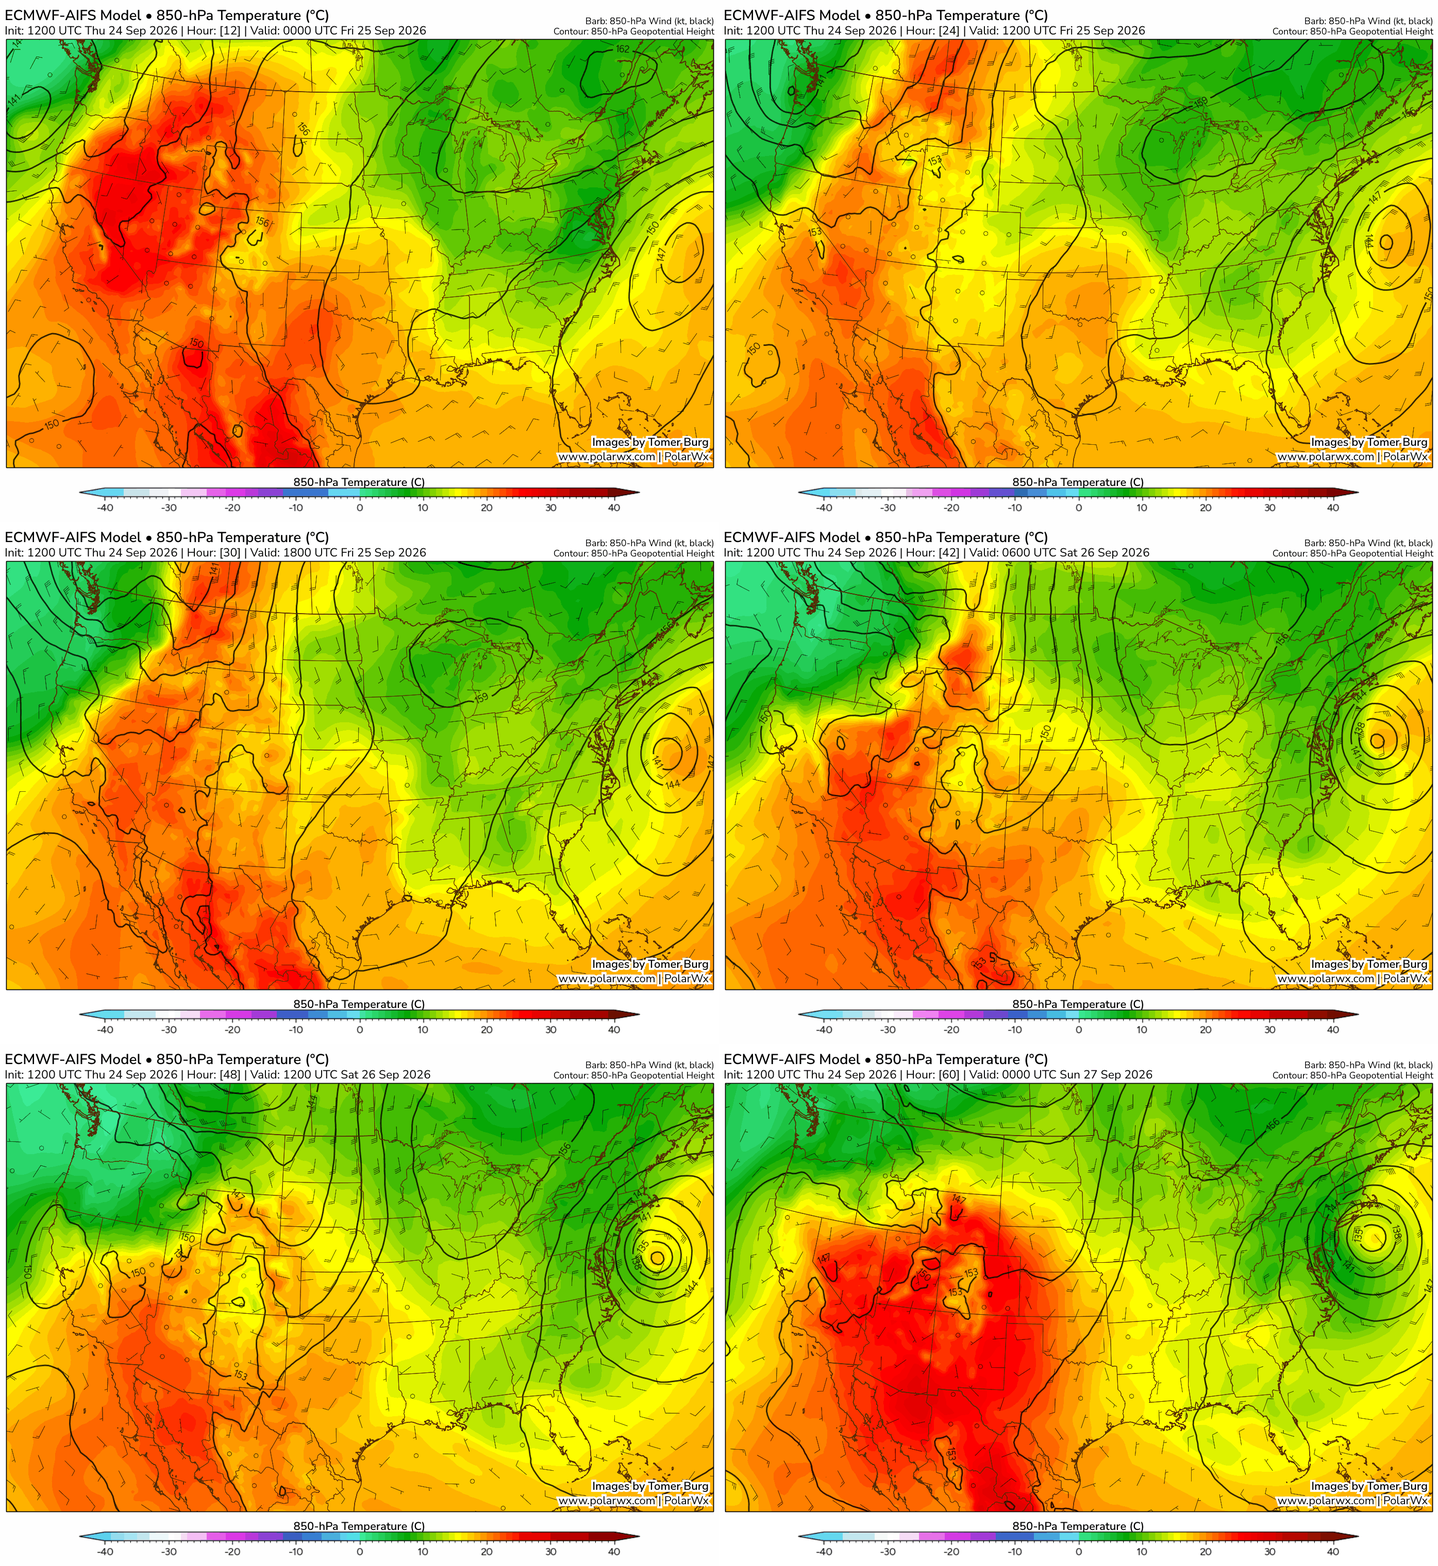
Let's test ECMWF's algorithm out for a valid time when it identified the deterministic AIFS as showing a tropical/subtropical cyclone. At this time shown above, the cyclone is clearly baroclinic, with a well-defined cold conveyor belt to its west, warm conveyor belt to its east, and and asymmetric thickness field.
Later into its evolution, we do see the emergence of a warm core in the 850-hPa temperature loop - which I will address in the next section why that factor on its own is also insufficient for tropical/subtropical classification. In fact, a warm-secluded nor'easter such as this case falls into the category of "well-occluded frontal depressions" false alarm cases warned about in ECMWF's methodology description.
Having written such an algorithm myself, I can describe firsthand the difficulties of objectively identifying all cyclones across all ensemble members and using their relatively coarse global fields - which are often too coarse to resolve the convective structure of the cyclone - to identify whether a cyclone is tropical, subtropical or extratropical, then validate it across many forecast cyclones that never developed in real life including false alarms.
Given these limitations, this is just one of several tools used to determine a storm's type, and should not be the sole or dominant determining factor.
Cyclone phase space and frontal structure #
On the subject of warm vs. cold core structure and depth, one commonly used tool is the cyclone phase space diagnostic developed by Hart (2003). It combines thermal wind and thermal symmetry to assess the structure of the cyclone (i.e., is it symmetric or asymmetric), whether it has a cold or warm core (i.e., is the center warmer or colder than its surrounding environment), and the depth of the warm core (i.e., is the warm core confined to the lower troposphere, or does it extend deep into the mid-upper troposphere). Generally, phase space diagrams aid in classification as follows:
- tropical cyclones have a symmetric and deep warm core (Example from Hurricane Ida 2021),
- subtropical cyclones have a symmetric or asymmetric but shallow warm core (Example from Subtropical Storm Andrea 2007), and
- extratropical cyclones especially in their development stage have an asymmetric cold core, which may transition to a shallow asymmetric or marginally symmetric warm core following warm seclusion.
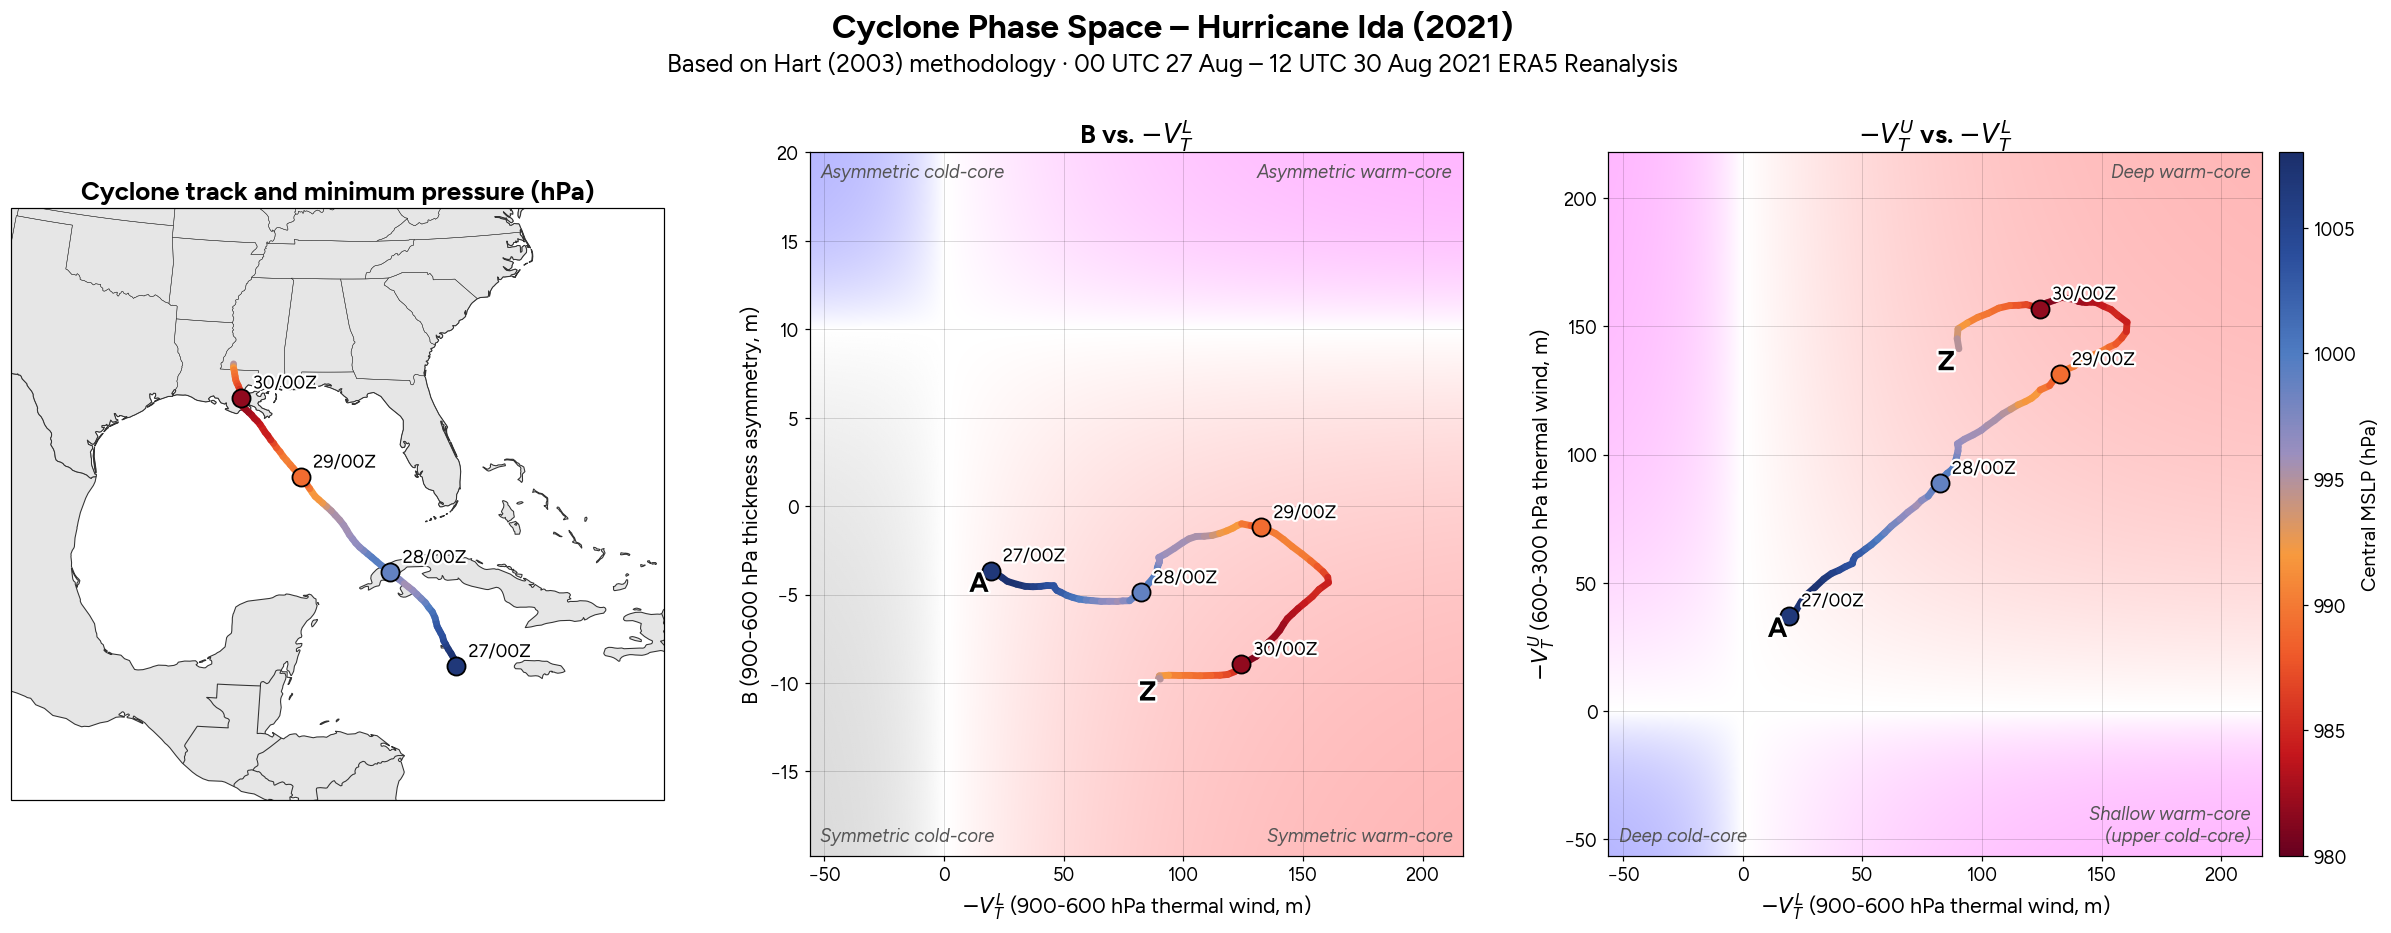
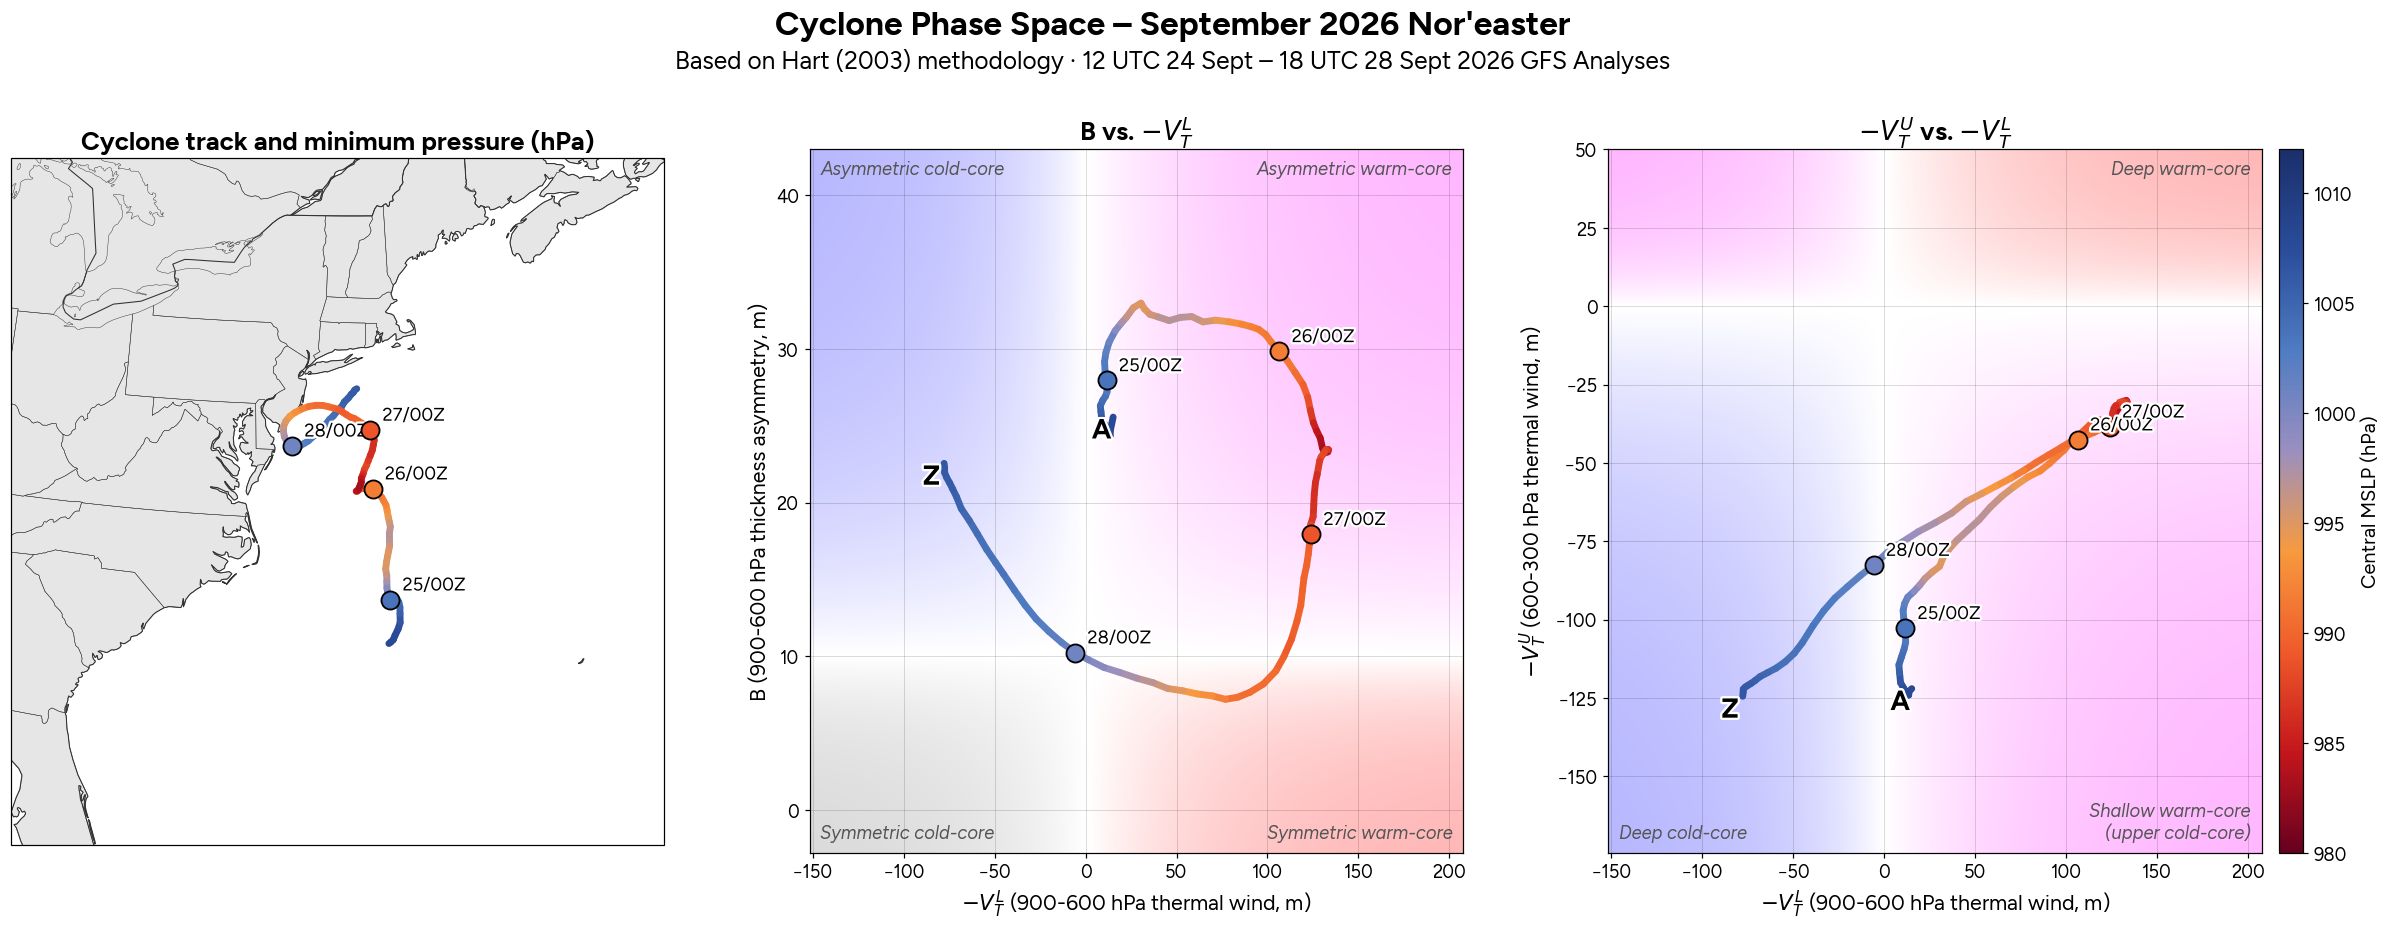
Running the Hart phase space diagnostics on this nor'easter shows several stages of its evolution. Its initial cyclogenesis on September 24-25 was characterized by an asymmetric shallow borderline cold/warm core. As it deepened and became warm secluded, it developed an asymmetric shallow warm core, which persisted as it phased with the tropopause vortex late on September 26. Towards the latter part of the phase until its completion on September 27, the lower-tropospheric thermal field briefly became more symmetric as the warm core weakened, before the cyclone transitioned back to a cold core by September 28.
That brief period early on September 27 when it became more symmetric is the closest it got to resembling a subtropical cyclone in phase space, but there's two important caveats to consider:
- This brief symmetry occurred as the magnitude of the warm core weakened - 850-hPa temperatures near the center rapidly cooled as the phase completed - rather than being maintained by convection had tropical transition continued to progress.
- The symmetry parameter in the phase space is only calculated for the 900-600 hPa layer, predominantly representing low-level symmetry. It is also computed relative to the storm motion vector, which at that time was rapidly turning to the west. As I discuss later in this section, water vapor imagery shows the mid-upper troposphere above the cyclone was highly asymmetric at this time as it phased with the tropopause vortex.
Additionally, the presence of a warm core is alone not sufficient for a subtropical/tropical classification - the phase space diagnostic for the January 2018 "bomb cyclone" also showed an asymmetric shallow-moderate warm core, and no meteorologist would argue it was a subtropical cyclone given its clearly strong baroclinic forcing and association with a frigid airmass with the polar jet.
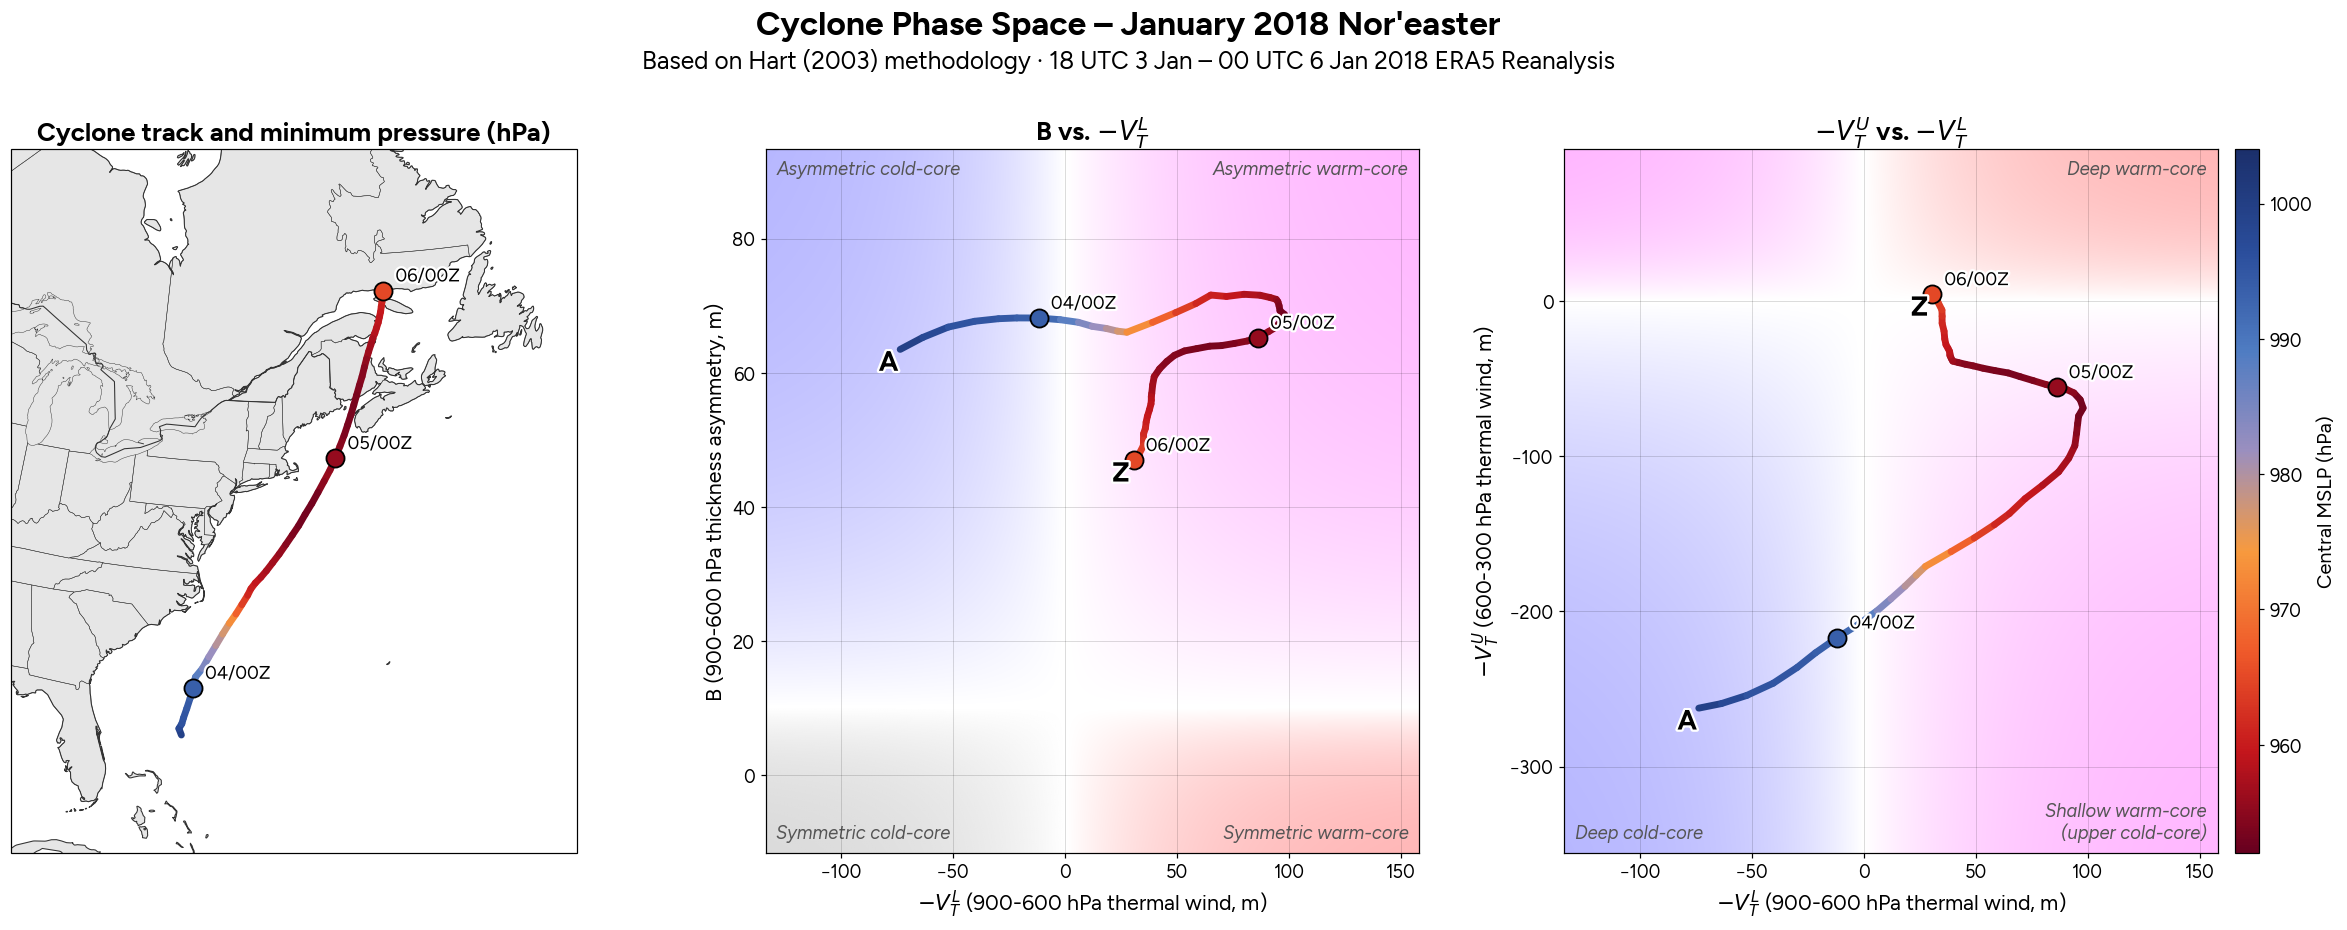
Did the cyclone have a warm core? Yes. Is a warm core on its own enough to classify a subtropical cyclone? No.
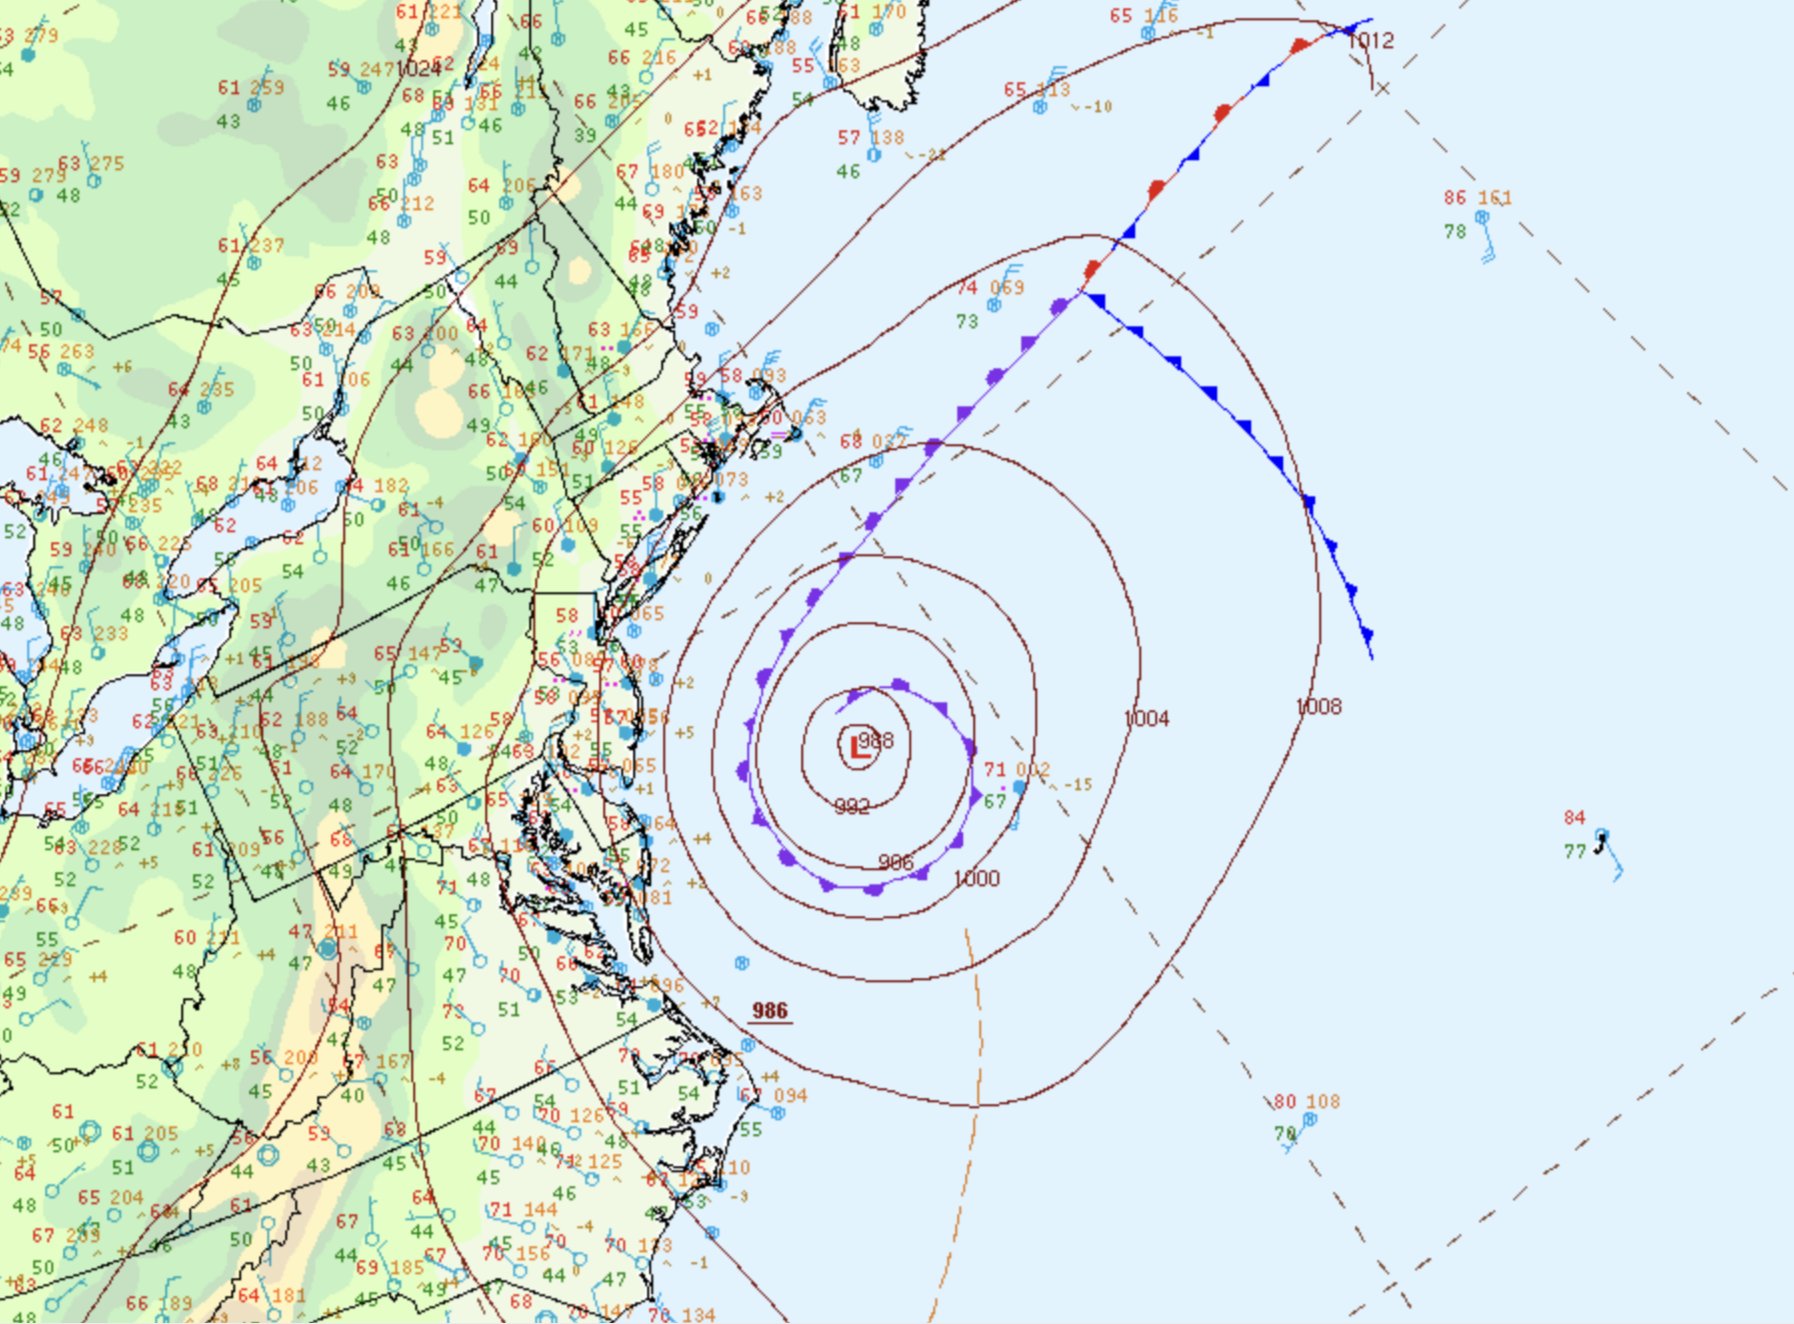
The next question to address is the frontal structure of the cyclone. On the left we also have the operational Weather Prediction Center (WPC) surface analysis, showing that on September 26, the cyclone's center was assessed to be detached from the occluded front wrapping around the center, characteristic of warm seclusion.
But separation from fronts alone isn't sufficient for a subtropical/tropical classification either - the WPC analysis for the February 2026 blizzard also assessed a warm secluded cyclone detached from its front, and no meteorologist would argue it was a subtropical cyclone either, especially as phase space diagnostics showed it was associated with a cold core.
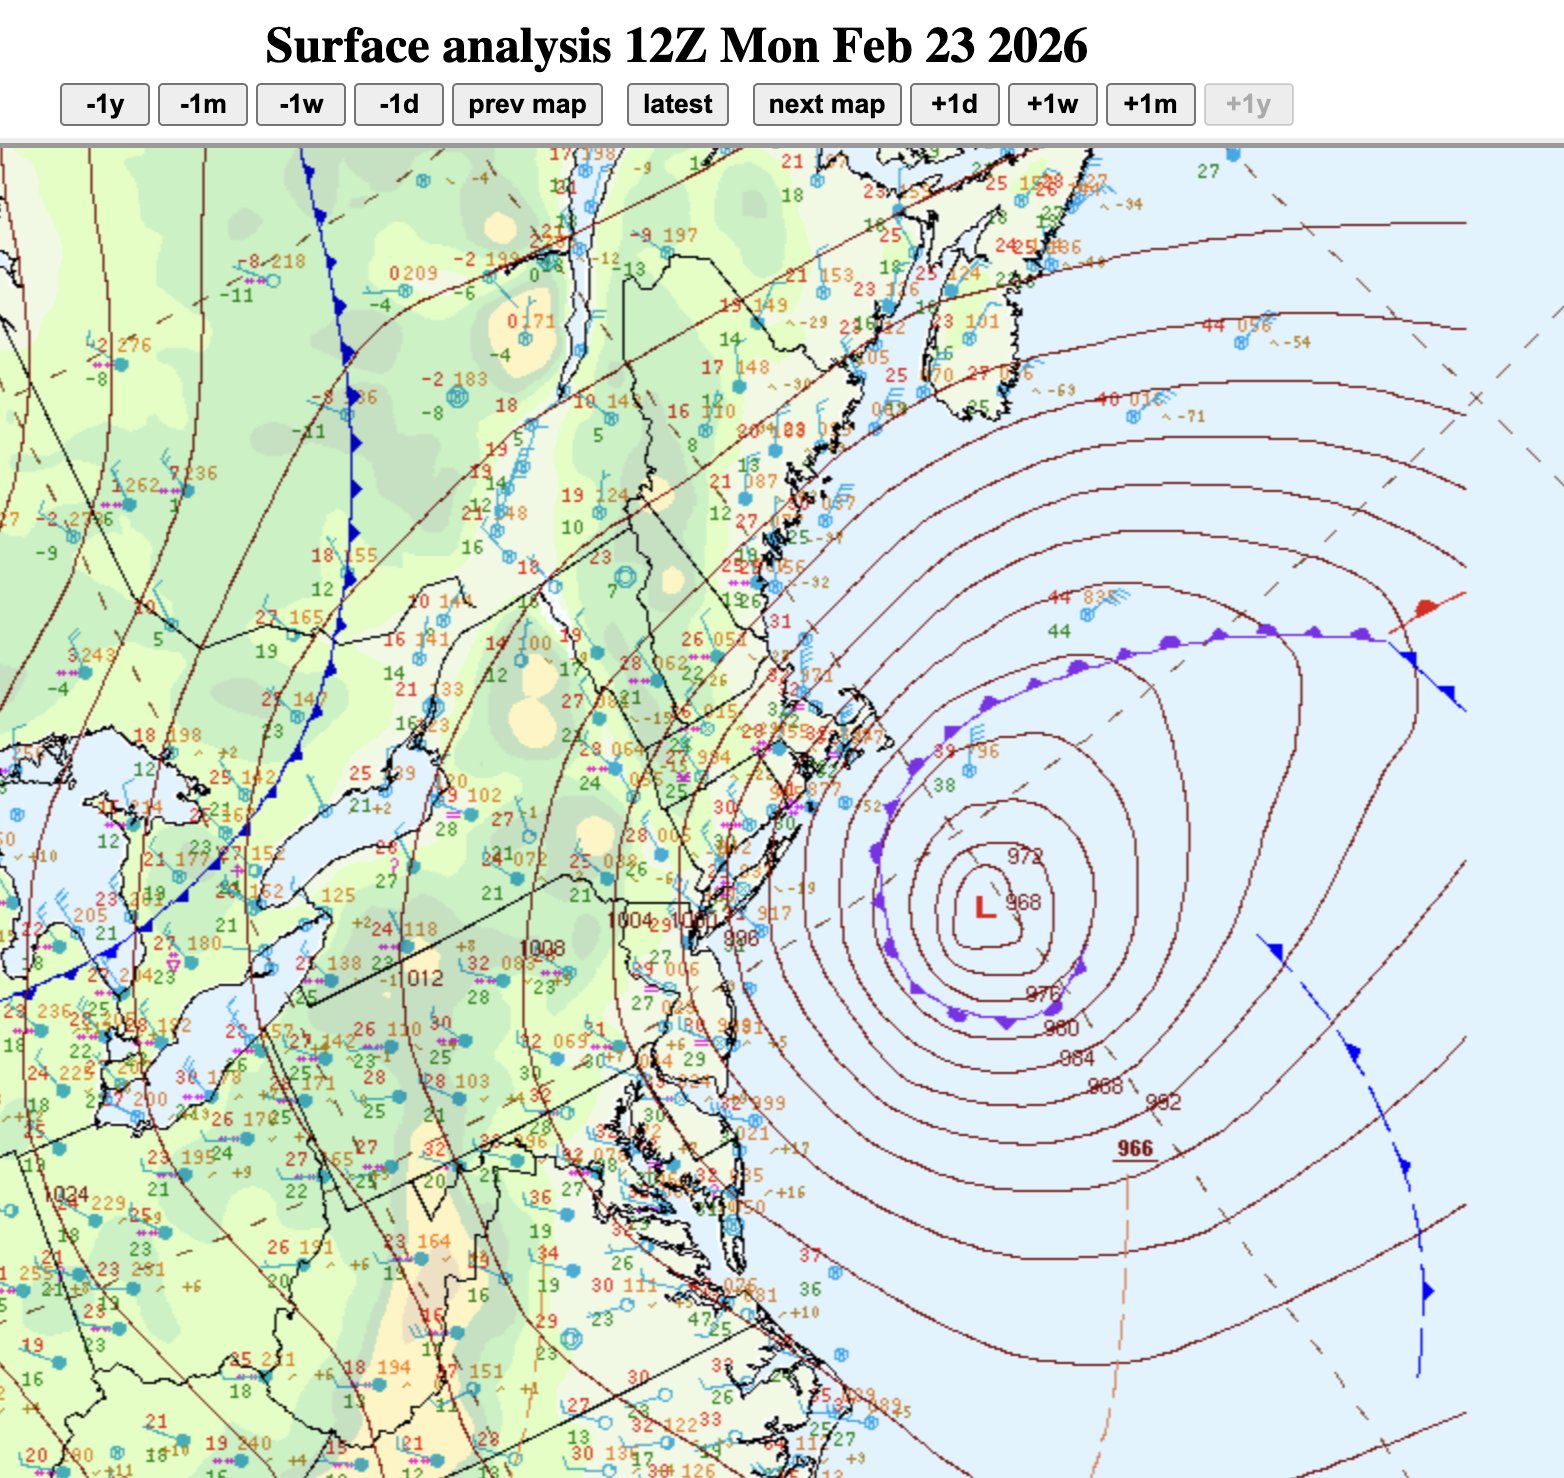
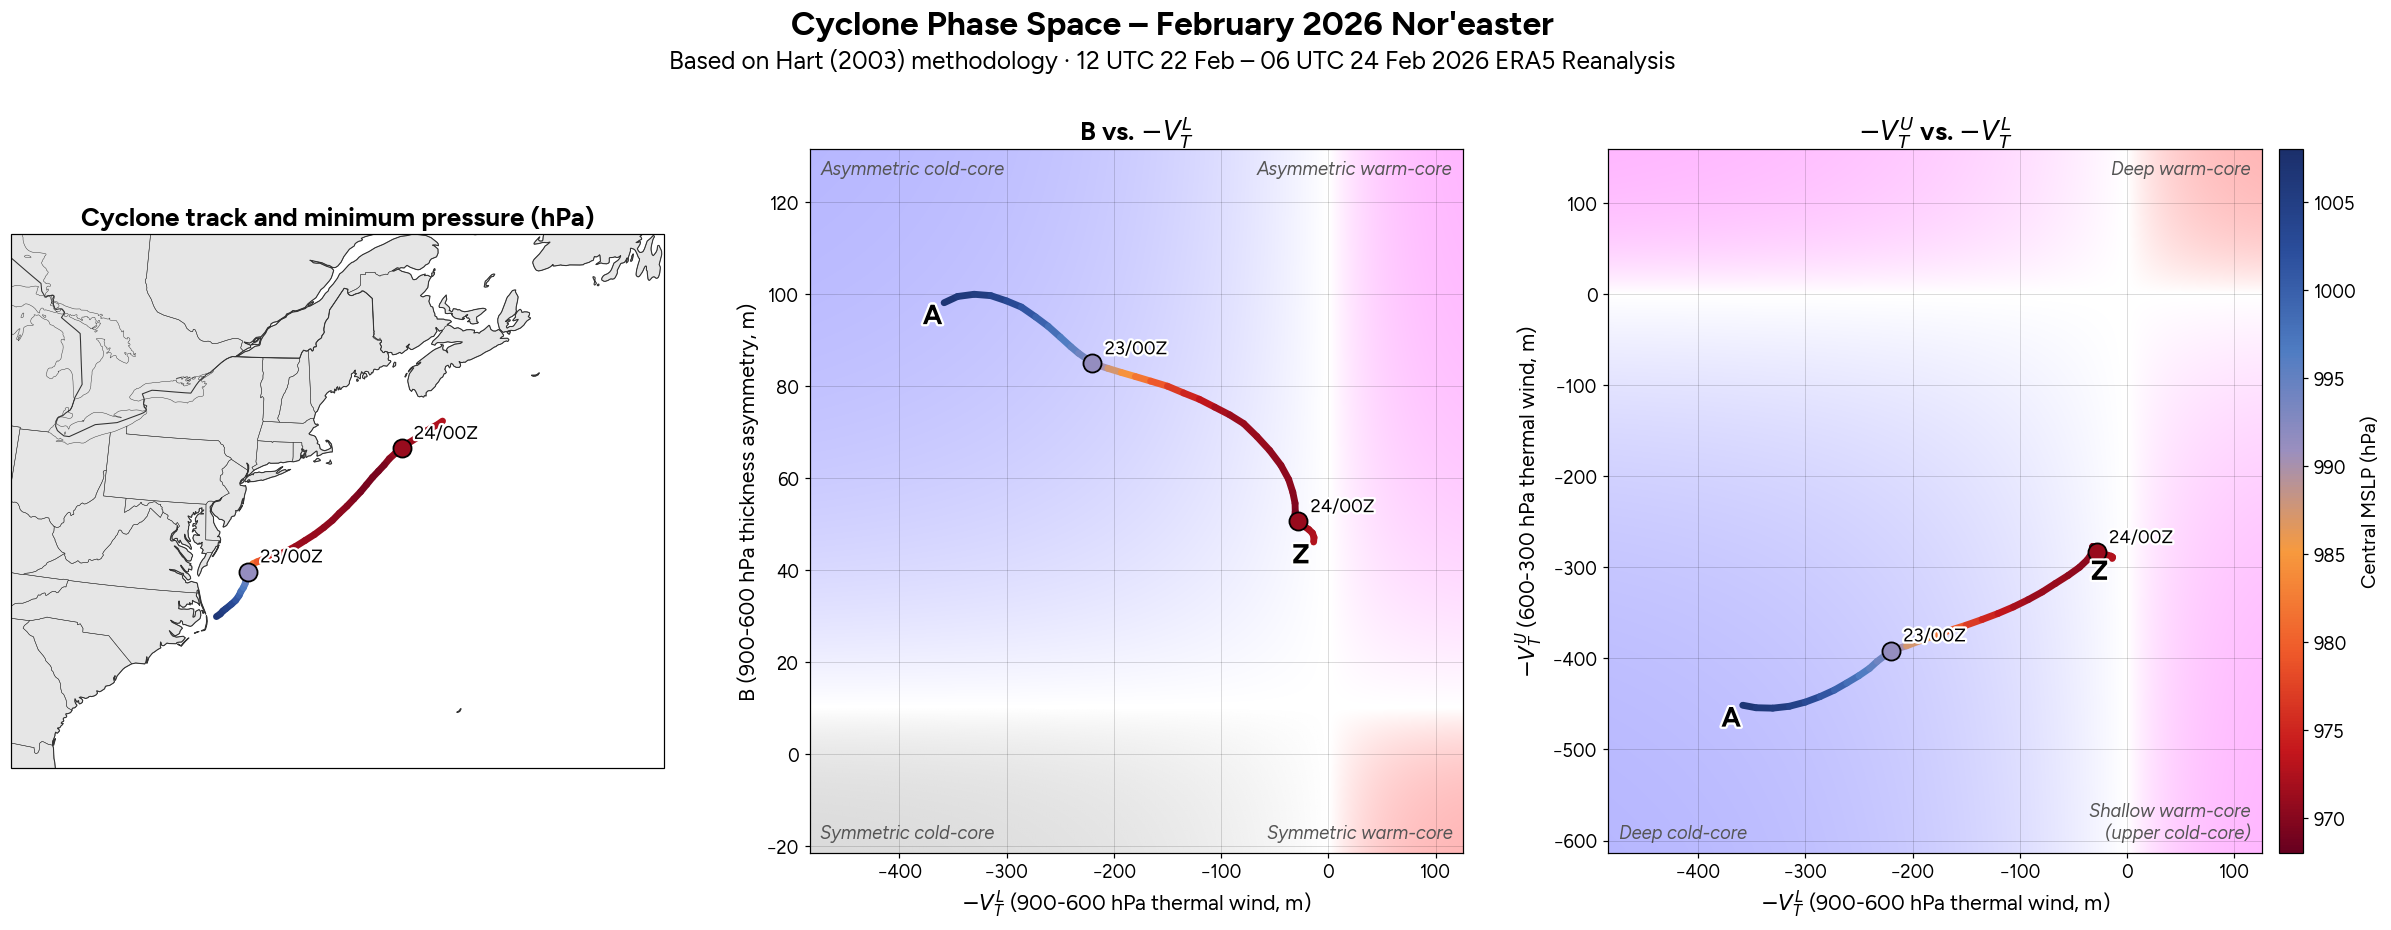
Did the cyclone separate from frontal boundaries? For a period of time, yes. Is this on its own sufficient to classify a subtropical cyclone? No.
Satellite-based structural evolution analysis #
Arguably, the strongest piece of evidence arguing against classifying the storm as subtropical or tropical comes from its structural evolution on satellite imagery.
Above is an annotated loop of the cyclone's evolution using GOES-19 mid-level water vapor. By early on September 26, the cyclone became warm secluded, its warm core became more well defined, it became detached from the occluded front, and the associated mid-upper tropospheric dry conveyor belt progressed downstream of the cyclone center, leaving the cyclone center in a relatively moist and warm low-mid level environment.
Not all warm secluded cylcones transition to subtropical or subtropical cyclones - but among those that do, this is the first phase of tropical transition, which describes the process by which a non-tropical cyclone transitions to a subtropical or tropical cyclone. This process is described in more detail in Davis and Bosart (2004), while Bentley and Metz (2016) analyze a real-life tropical transition case from 2006. The next phase would require the cyclone to begin generating and sustaining convection, often denoting the transition to a subtropical cyclone. This convection would be initially sustained by reduced deep-layer stability near the center due to the lowered tropopause associated with the parent upper-tropospheric trough. As tropical transition continues, differential latent heating associated with the convection redistributes the upper-tropospheric PV and decreases horizontal PV gradients above the cyclone. This has the combined effect of deepening the warm core depth, and situating the cyclone in a pocket of relatively low shear, at which point the cyclone transitions to a fully warm-core tropical cyclone with deep convection sustained via ocean surface fluxes.
Tropical transition failed to progress substantially beyond this point, however. Besides two short-lived bursts of deep convection just north of the center (downshear), the first around 16 UTC 26 September (which quickly dissipated with its remnant cirrus moving to the northeast), and the second around 02 UTC 27 September as the phase with the tropopause vortex was underway, the center was completely devoid of any moderate to deep convection, and the only convection anywhere in the vicinity was shallow convection north of the center associated with isentropic ascent along the frontal boundary. In the next section we'll look at why this was the case.
Did the cyclone develop organized moderate to deep convection? No.
Environmental instability #
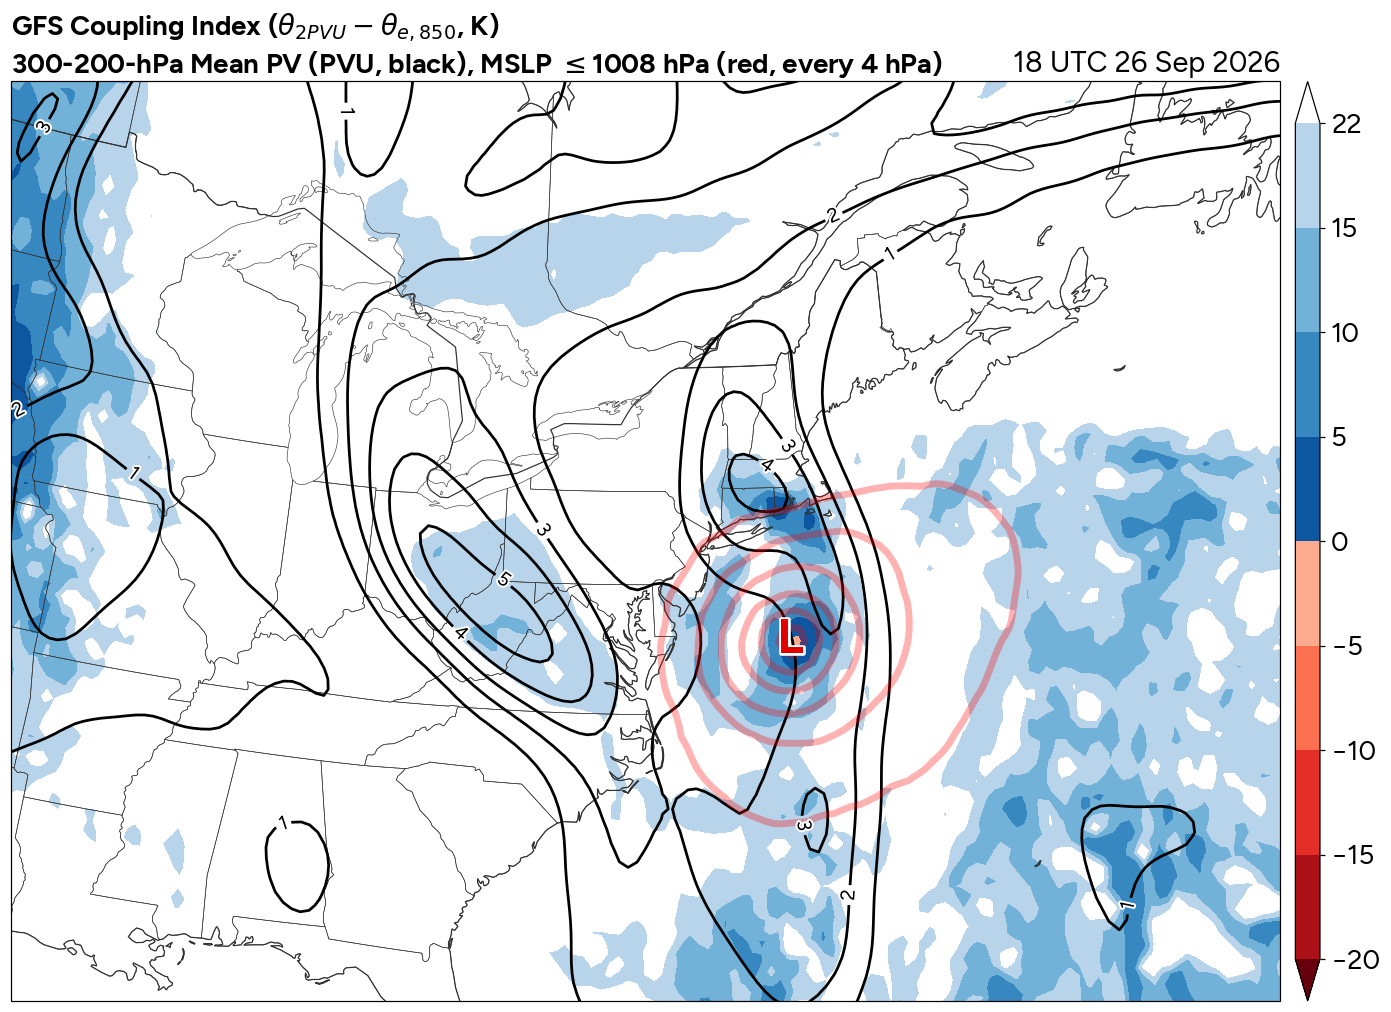
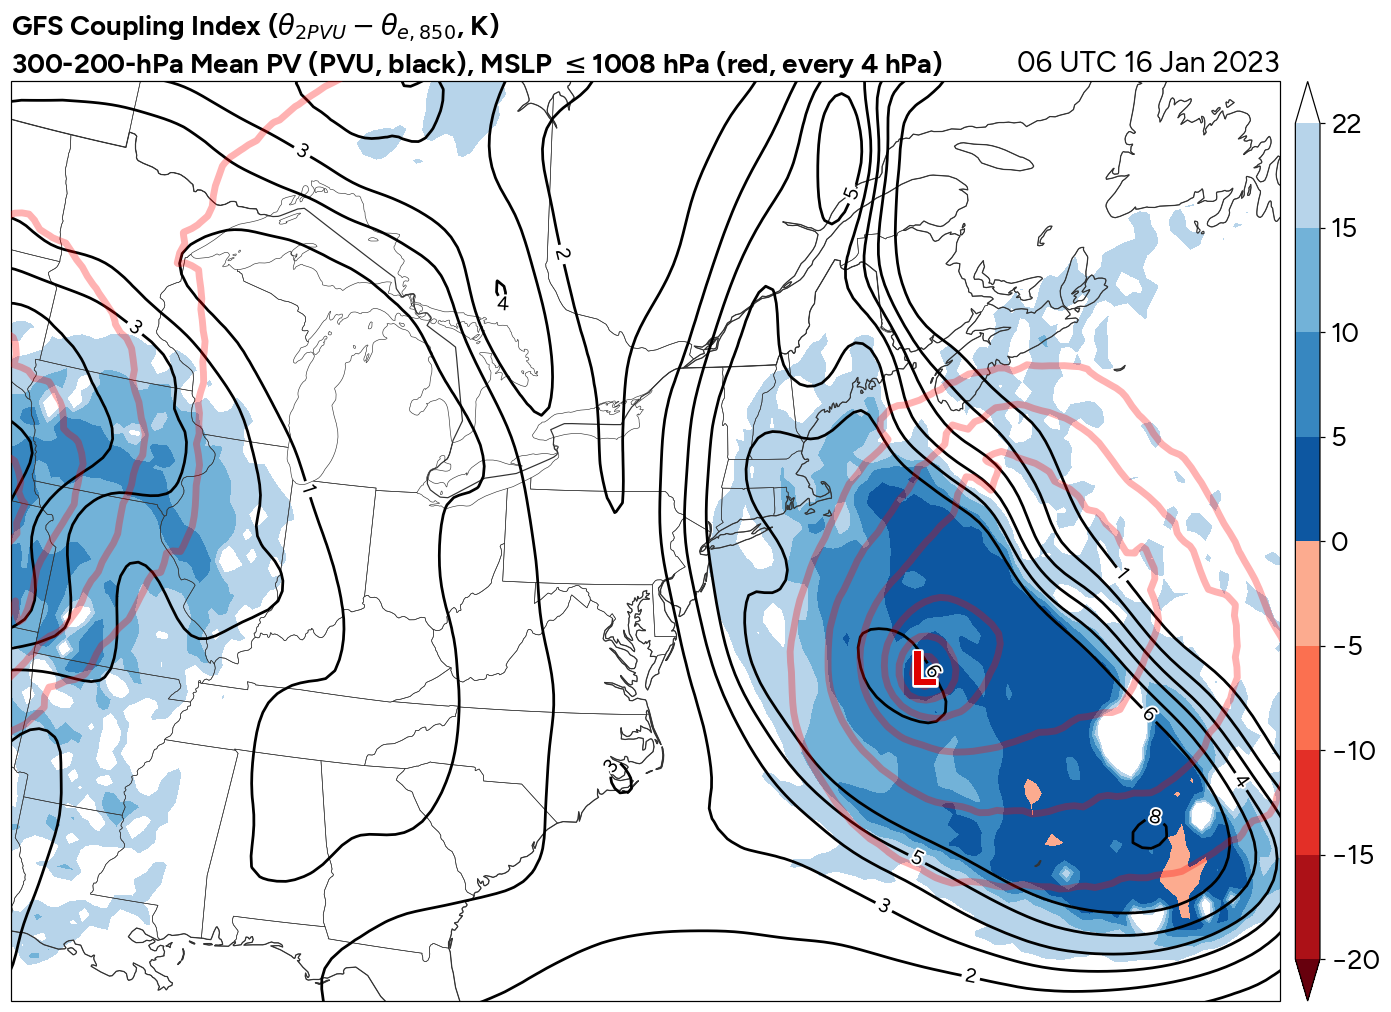
The near total lack of deep convection is likely in part indicative of relatively less environmental instability than in other successful cases of tropical transition. One way to assess tropospheric instability is the Coupling Index (CI), defined by Bosart and Lackmann (1995) as the difference between tropopause potential temperature and 850-hPa equivalent potential temperature. McTaggart-Cowan et al. (2015) further found that a CI of 22.5°C is generally an upper bound for tropical/subtropical cyclone development through TT.
In this case, the CI directly within the cyclone center was near 0°C, though this was almost certainly locally driven by the previously discussed 850-hPa theta-e warm core. Farther away from the cyclone center, CI values were much more marginal for tropical transition, and the PV contours show the cyclone was situated beneath a weak and deformed PV filament.
Let's contrast this with a successful case of tropical transition from January 2023. This was an exceptionally rare case of tropical transition - January tropical or subtropical cyclones are extremely rare anywhere in the Atlantic basin, but this case had a similar tropical transition pathway from a warm secluded East Coast cyclone. In this case, following warm seclusion, the cyclone center fully detached from nearby frontal boundaries and developed sustained moderate to deep convection, at which point it transitioned to a subtropical cyclone. The presence of sustained organized moderate to intermittently deep convection was the strongest argument for classification as a subtropical cyclone - if you recall the Subtropical Storm Andrea loop from earlier, it also developed organized sustained convection as tropical transition progressed.
Comparing the CI plot for the 2026 nor'easter with the 2023 subtropical cyclone shows a clear difference in not only more widespread very low CI values situated directly beneath a broad upper-level trough, indicative of an environment more uniformly characterized by low tropospheric stability, but the upper-level PV above the cyclone is also more spatially uniform, consistent with the PV redistribution and pocket of low shear discussed by Davis and Bosart (2004) which allows tropical transition to proceed.
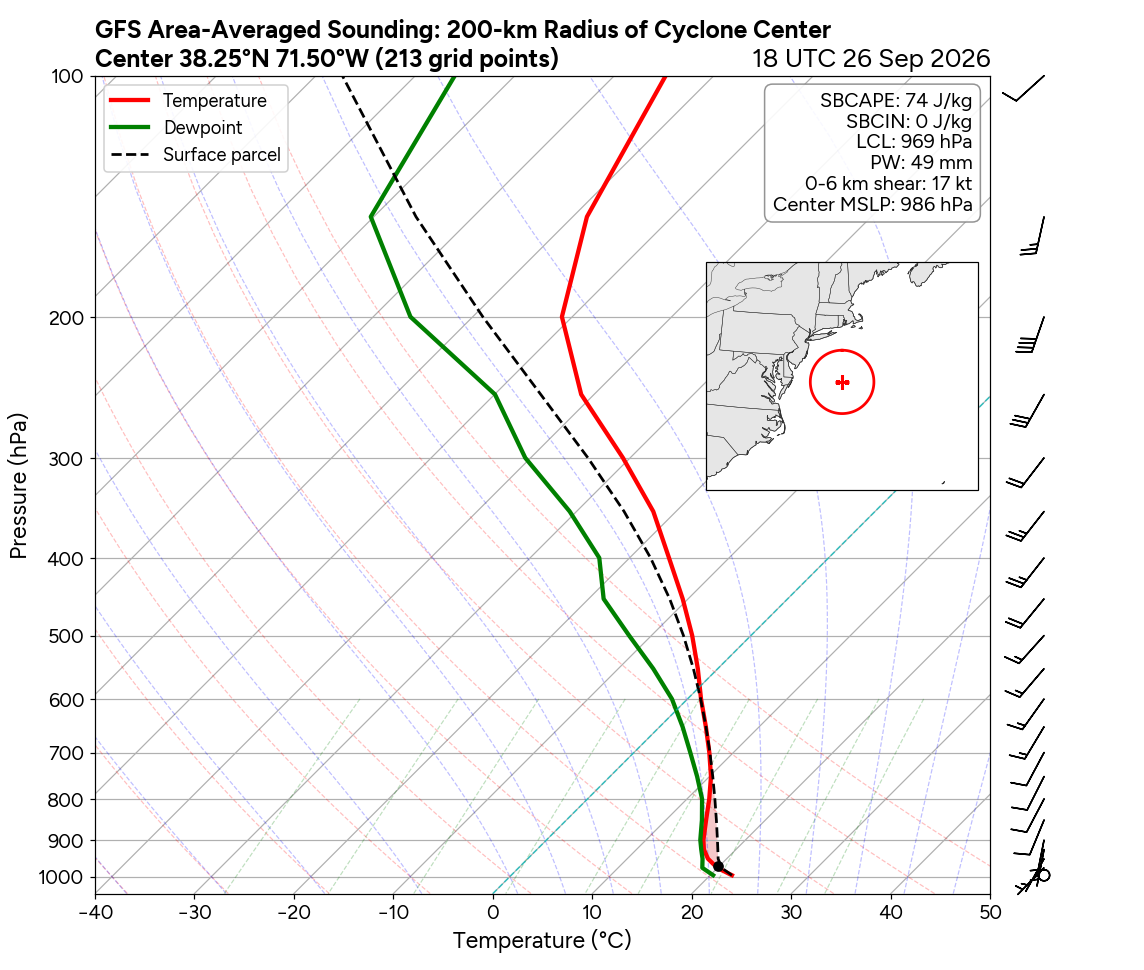
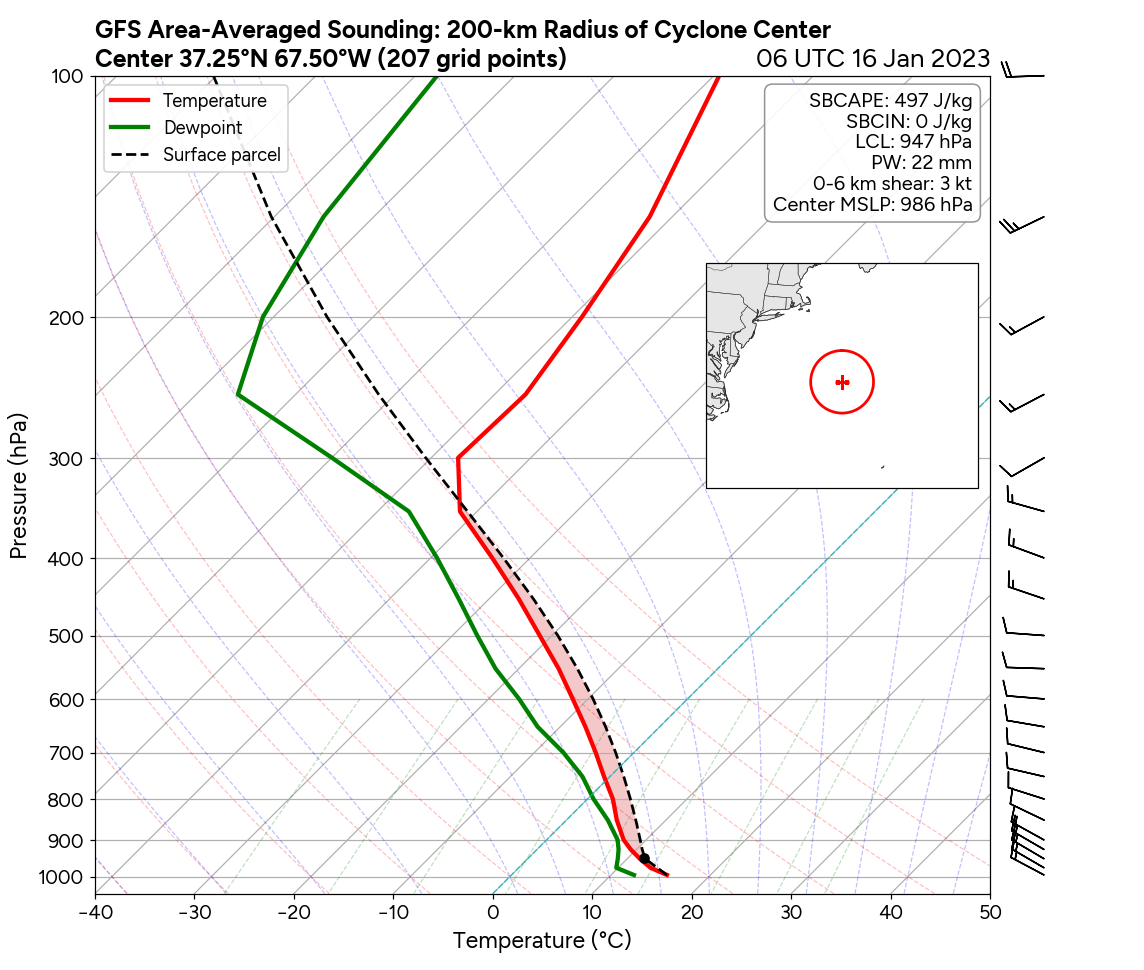
One last point to drive home the different environments between the two storms is their area-averaged soundings. Despite the 2026 nor'easter having much warmer SSTs and low-level temperatures than the 2023 subtropical cyclone, the 2023 case had a much lower tropopause and accordingly had more area-averaged CAPE than the 2026 case. The 2023 case also has much lower deep-layer shear than the 2026 case - 3 kt in 2023 vs. 17 kt in 2026 - which also ties into the aforementioned process of how shear magnitude decreases as part of the tropical transition process. These factors help explain why the 2026 case failed to develop sustained deep convection following warm seclusion.
Piecing everything together #
We established that the cyclone met some of the characteristics associated with subtropical cyclones - it detached from frontal boundaries and it had a shallow asymmetric warm core. The biggest factors arguing against classification are the near-total lack of organized and sustained moderate to deep convection, and the short duration following its detachment from frontal boundaries before a subsequent phase with a tropopause vortex reintroduced significant mid-upper tropospheric baroclinicity and asymmetry. We also reviewed why operational tools that show probability of tropical cyclone formation can be constrained by algorithmic limitations in cases like this.
Comparing this cyclone against two other cases of tropical transition - Andrea 2007 and an unnamed 2023 storm - shows they were able to form and sustain organized moderate to deep convection. This storm was constrained by higher tropospheric stability, and without sustained deep convection, there was no convectively driven upper-level PV redistribution that would've enabled a more favorable environment for tropical transition to continue.
Section 3: Forecast communication challenges #
If you were following broadcast and social media forecasts for the nor'easter in its lead-up, you may have encountered headlines such as "Over 60 million in danger from nor'easter", "Flash floods could sweep US region as nor’easter threatens millions along East Coast ", and "Monster nor'easter impacts U.S. east coast". Forecasts also warned of the risks of significant flooding from heavy rain and storm surge, as well as hurricane-force wind gusts, meaning wind gusts over 74 mph (which itself isn't the same thing as hurricane conditions, as that refers to sustained wind is over 74 mph).
Putting aside the most extreme clickbait on social media or alarmist wording - such as "60 million people in danger from nor'easter", when 60 million people is likely about how many people were going to be impacted in some way by the nor'easter, rather than how many would face the worst risks from it - many of the warnings of the most severe impacts were correct. Parts of New Jersey and Massachusetts recorded over 8 inches of rain, and wind gusts exceeded 75-80 mph along parts of the coastal corridor from New Jersey to Massachusetts. The problem? A headline is too short to make it clear exactly where the worst of the impacts will be, and a short video or article isn't enough to describe what impacts will be in every town, especially away from the coast where flooding risks are dependent on local terrain and infrastructure.
For many locations away from the coast, from the worst of the heavy rain, and from typically flood-prone areas, it was just like any other rainy weekend - especially on Saturday and parts of Sunday with prolonged breaks from the steady rain. Residents living in these areas who were routinely exposed to dire warnings about the storm from headlines or short videos might feel that the warnings were greatly exaggerated, even though the actual forecast for their location was never expected to reach the kind of destructive impacts that were seen along the coast.
I am admittedly not an expert in weather communication research, and giving specific recommendations on best practices for these kinds of situations is outside of my scope. But I'd be remiss not to point out the challenges I saw in the lead-up to the storm, which may have influenced how the public perceived the impacts they expected vs. what they actually experienced, and which at worst could contribute to warning fatigue.